Blazing Fast, Dynamic Logging with SenseLogs

SenseLogs is a simple, flexible, dynamic, blazing fast log library designed exclusively for serverless apps using NodeJS.
While there are many other good logging libraries that claim to be flexible and fast, they were not designed for serverless. They are thus bigger and slower than necessary and don’t meet the unique logging needs of serverless.
SenseLogs is more than 6x faster than the Pino logging library.
Serverless apps have special requirements like minimizing cold-start time and being exceptionally efficient due short execution lifespans of most Lambda invocations. Furthermore, the ephemeral nature of serverless makes it difficult to remotely control the volume and type of emitted log messages without redeploying code.
SenseLogs was designed to work in this environment and offers a fast, dynamic logging library exclusively for serverless. SenseLogs offers a flexible API to simply log data with rich context in JSON and then dynamically control which messages are emitted at run-time without redeploying your functions.
SenseLogs Overview
Here are some of the key features of SenseLogs:
- Extremely fast initialization time to shorten cold-starts.
- Up to 7 times faster than the nearest competitor logger.
- Flexible log channels and filters.
- Dynamic log control to change log filters without redeploying.
- Log sampling to emit increased logs for a percentage of requests.
- Emits logs in JSON with rich context.
- For local debugging, emits in human readable formats.
- Inheriting child log instances for per-module logging.
- Stack capture for uncaught exceptions.
- Easily emit CloudWatch custom metrics using EMF.
- Integrates with SenseDeep developer studio.
- No dependencies.
- Clean, readable small code base (<500 lines).
- Full TypeScript support.
Quick Tour
Install the library using npm or yarn.
npm i senselogs
Import the SenseLogs library. If you are not using ES modules or TypeScript, use require to import the library.
import SenseLogs from 'senselogs'
Create and configure a logger.
const log = new SenseLogs()
Then log with a message:
log.info('Simple messsage')
log.error(`Request error for user: ${user.email}`)
You can also supply addition data to log via a map of additional context information.
log.error('Another log error message with context', {
    requestId: 1234,
    userId: '58b23f29-3f84-43ff-a767-18d83500dbd3'
})
This will emit
{
    "message": "Another log error message with context",
    "requestId": 1234,
    "userId": "58b23f29-3f84-43ff-a767-18d83500dbd3"
}
Log Channels
To implement observability for your serverless apps, you need to proactively embed logging that captures rich and complete request state. This logging needs to impose little to no overhead and ideally, should be remotely manageable to activate without needing to redeploy code.
SenseLogs achieves this via log channels and log filters. SenseLogs organizes log messages via channels which are names given to classify log message types. You can then select log messages to emit by filtering on channel names.
SenseLogs provides standard channels like: debug, error, fatal, warn and info.
log.error('Bad things happen sometimes')
log.error(new Error('Invalid request state'), {requestId})

log.debug('The queue was empty')
log.trace('Database request', {request})
You can extend upon this basic set of channels and use your own custom channels via the emit API. For example:
log.emit('custom-channel', 'My custom channel')
Message Filtering
SenseLogs selects log messages to emit depending on whether the log channel is enabled in the log filter. The log filter is a set of channel names that are enabled for output.
The default log filter will emit messages for the fatal, error, metrics, info and warn, channels. The data, debug and trace channels will be hidden by default.
You can change the filter set at any time to add or remove filters. For example, to enable the output of log messages for the data and debug channels.
log.addFilter(['data', 'debug'])
Context Information
It is highly desirable to emit detailed request information in each logging call such as X-Ray IDs, API Gateway request IDs and other critical context information. It is cumbersome to encode this information explicitly in each logging call. It is much better to define once and have it inherited by each logging call.
SenseLogs supports this by providing additional log information via contexts. These can be defined and updated at any point and will be included in the logged data by each logging call.
log.addContext({ userId })

log.info('Basic message', {
    event: "Login event",
})
This will emit the logged message with the additional contexts:
{
    "message": "Basic Message",
    "event": "Login event",
    "userId": "58b23f29-3f84-43ff-a767-18d83500dbd3"
}
Dynamic Logging Control
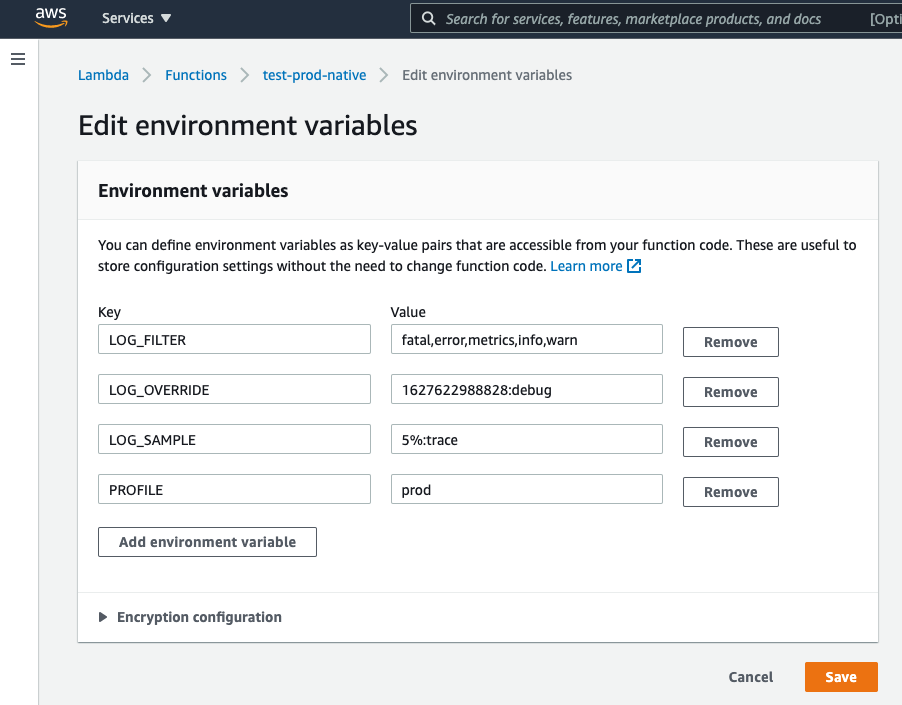
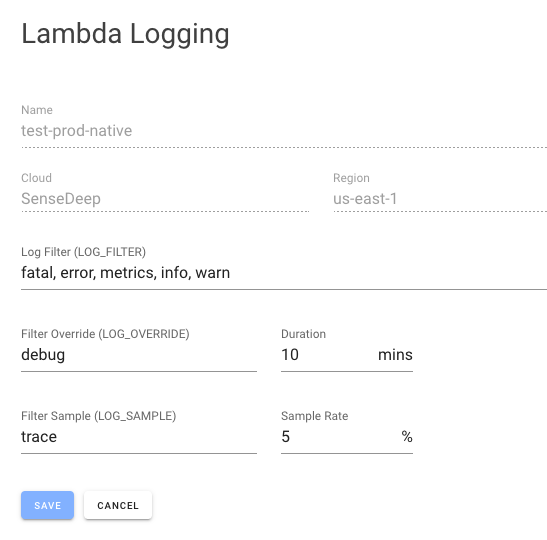
SenseLogs manages log filtering via environment variables that determine the log filter sets. If you change these environment variables, the next time your Lambda function is invoked, it will be loaded with the new environment variable values. In this manner, you can dynamically and immediately control logging output without modifying code or redeploying.
SenseLogs keeps three log filter sets:
- The default filter via the LOG_FILTER environment variable.
- The override filter via LOG_OVERRIDE.
- The sample filter via LOG_SAMPLE.
The default set defines the base set of log channels that are enabled for output. The override set is added to the default set for a limited time duration. The sample set is added to the default set for a percentage of log requests.
You can change these environment values via the AWS console or via the AWS CLI.

Better still, the SenseDeep Serverless Studio provides an integrated, high-level way to manage these filter settings.

CloudWatch Metrics and EMF
AWS CloudWatch can receive custom metrics via log data according to the Embedded Metric Format (EMF).
SenseLogs makes it easy to emit your application metrics via the SenseLogs metrics log channel. For example:
log.metrics('info', 'Acme/Rockets', {Launches: 1})
Once emitted, you can view and track your metrics in the AWS console or in the SenseLogs dashboard.
Benchmarks
Because SenseLogs was designed exclusively for serverless, it does not carry unnecessary enterprise baggage and is blazing fast for serverless logging tasks.
Here are the results of benchmarks against the self-claimed fastest logger Pino.
SenseLogs 6.5 times faster than the best alternative.
| Logger | Time | Code Size |
|---|---|---|
| SenseLogs | 477 ms | 478 lines (commented) |
| Pino | 3,269 ms | 1281 lines (comments stripped) |
More?
SenseLogs is provided open source (MIT license) from GitHub SenseLogs or NPM SenseLogs.
You can read more in the detailed documentation including the full API at:
Try SenseDeep
Start your free 14 day trial of the SenseDeep Developer Studio.


Messages are moderated.
Your message will be posted shortly.
Your message could not be processed at this time.
Error: {{error}}
Please retry later.
{{comment.name || 'Anon'}} said ...
{{comment.message}}