CustomMetrics -- Simple, Cost-Effective Metrics for AWS
AWS CloudWatch offers metrics for monitoring specific aspects of your applications. However, AWS custom metrics can become costly when updated or queried frequently, with each custom metric costing up to $3.60 per metric per year, along with additional expenses for querying. If you have a significant number of metrics or high dimensionality in your metrics, this could result in a substantial CloudWatch Metrics bill.
On the other hand, CustomMetrics presents a cost-effective alternative metrics API that is considerably more budget-friendly and efficient compared to standard CloudWatch metrics.
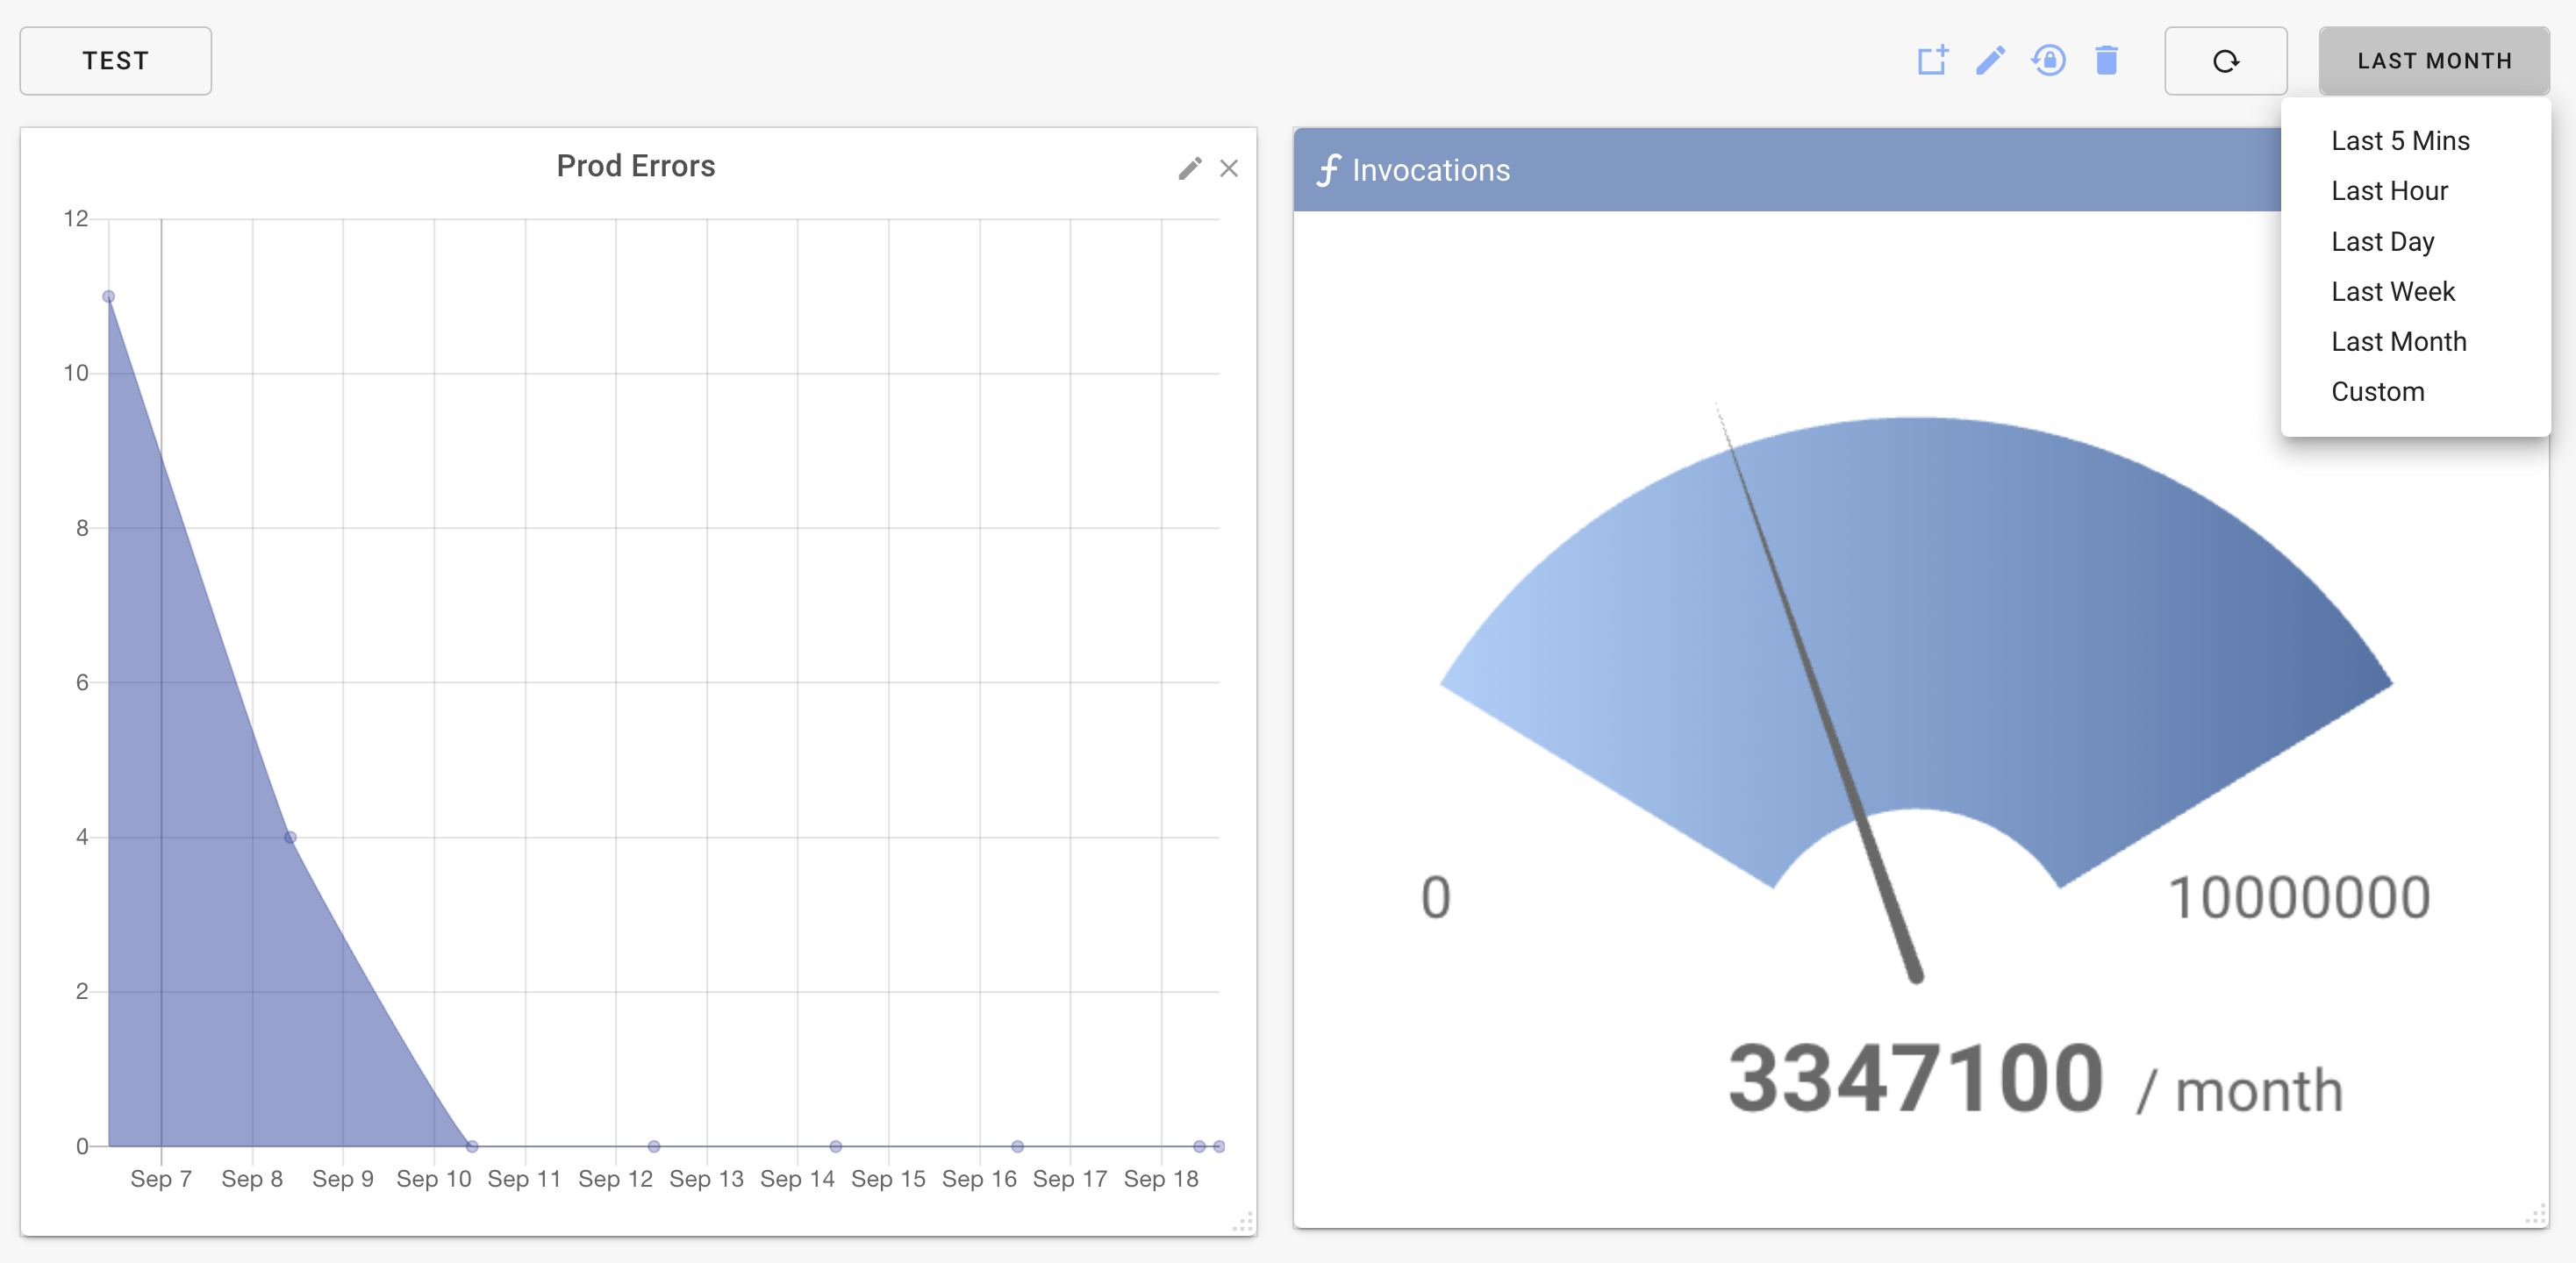
The cost savings achieved by CustomMetrics are primarily due to its focus on providing only the most recent period metrics, such as those from the last day, last month, last hour, last 5 minutes, and so on. These metric timespans are also fully configurable. This approach ensures that each metric can be saved, stored, and queried with minimal cost.
AWS CloudWatch Metrics
Frequently, users complain that CloudWatch is one of the most expensive parts of their AWS bill. For those users that employ AWS metrics with high update frequency or high dimensionality, this can quickly translate into a large bill.
CloudWatch charges based on the number of metrics sent to the service and the frequency of updating or querying metrics. Your bill will increase as you send more metrics to CloudWatch and make API calls more frequently. For a regularly updated or queried metric, you will pay $0.30 per metric per month for the first $3,000 per month.
AWS metrics are expensive because they store metrics with arbitrary data spans. You can query metrics for any desired period (with decreasing granularity as the metrics age). On the positive side of the ledger, you can use CloudWatch EMF log format to emit metrics from Lambda’s without invoking an API. But you still pay for maintenance of the metric.
CustomMetrics Alternative
CustomMetrics foregoes the option for arbitrary date queries and provides “latest” period metrics only. When using CustomMetrics, you request data for specific recent time spans such as the last “5 minutes”, “hour”, “day”, “week”, “month”, or “year”. You have the flexibility to configure these “last” time spans according to your preferences, but they are always based on the current time. For example, you could record metrics for the last “minute” and “15 minutes”.
In exchange for its exclusive emphasis on the most recent metrics, CustomMetrics can store and retrieve metrics at a significantly lower cost compared to CloudWatch custom metrics.
CustomMetrics Features
CustomMetrics is a NodeJS library designed to emit and query custom metrics for AWS applications. Is offers the following features:
- Simple one line API to emit metrics from any NodeJS TypeScript or JavaScript app.
- Similar metric model to AWS CloudWatch for supporting namespaces, metrics, dimensions, statistics and intervals.
- Computes statistics for: average, min, max, count and sum.
- Computes P value statistics with configurable P value resolution.
- Supports a default metric intervals of: last 5 mins, hour, day, week, month and year.
- Configurable custom intervals for different metric timespans and intervals.
- Fast and flexible metric query API.
- Query API can return data points or aggregate metric data to a single statistic.
- Scalable to support many simultaneous clients emitting metrics.
- Stores data in any existing DynamoDB table and coexists with existing app data.
- Supports multiple services, apps, namespaces and metrics in a single DynamoDB table.
- Extremely fast initialization time.
- Written in TypeScript with full TypeScript support.
- Clean, readable, small, TypeScript code base (~1.3K lines).
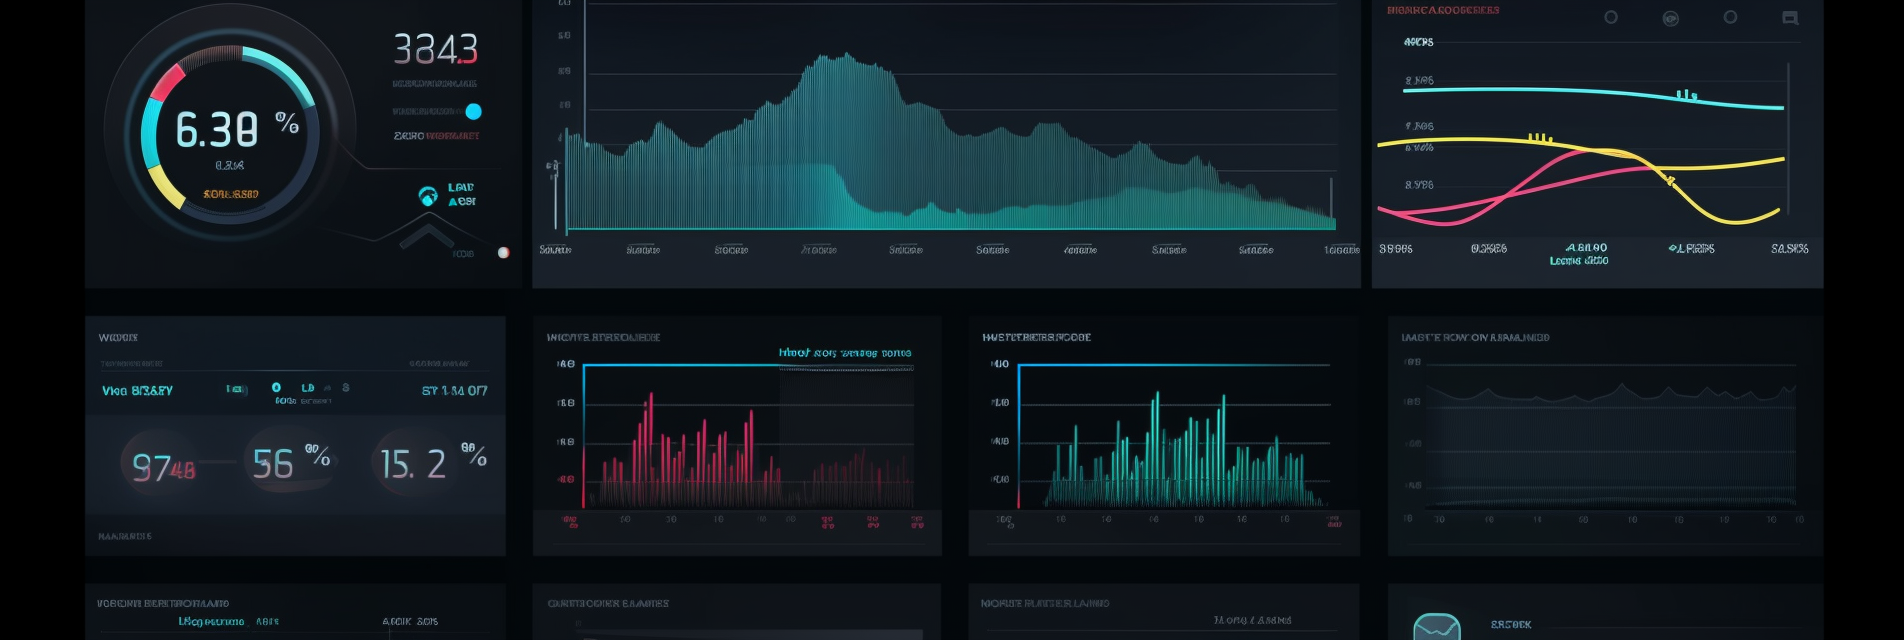
- SenseDeep support for visualizing and graphing metrics.
- DynamoDB Onetable supports CustomMetrics for detailed single table metrics.
Database
CustomMetrics stores each metric in a single, compressed DynamoDB item. Each metric stores the optimized data points for the metric’s timespans. The default spans are 5 mins, 1 hour, 1 day, 1 week, 1 month and 1 year. But these can be configured for each CustomMetric instance.
Emitting a metric via the emit API will write the metric via a DynamoDB item update. Multiple simulataneous clients can update the same metrics, and CustomMetrics will ensure no data is lost.
If optimized metric buffering is enabled, metric updates may be aggregated according to your buffering policy to minimize the database write load.
Quick Tour
Here is a quick tour of CustomMetrics demonstrating how to install, configure and use it in your apps.
First install the library using npm:
npm i custom-metrics
Import the CustomMetrics library. If you are not using ES modules or TypeScript, use require to import the library.
import {CustomMetrics} from 'CustomMetrics'
Next create and configure the CustomMetrics instance by nominating the DynamoDB table and key structure to hold your metrics.
const metrics = new CustomMetrics({
    table: 'MyTable',
    region: 'us-east-1',
    primaryKey: 'pk',
    sortKey: 'sk',
})
Metrics are stored in the DynamoDB database referenced by the table name in the desired region. This table can be your existing application DynamoDB table and metrics can safely coexist with your app data.
The primaryKey and sortKey are the primary and sort keys for the main table index. These default to ‘pk’ and ‘sk’ respectively. CustomMetrics does not support tables without a sort key.
If you have an existing AWS SDK V3 DynamoDB client instance, you can use that with the CustomMetrics constructor. This will have slightly faster initialization time than simply providing the table name.
import {DynamoDBClient} from '@aws-sdk/client-dynamodb'
const dynamoDbClient = new DynamoDBClient()
const metrics = new CustomMetrics({
    client: myDynamoDbClient,
    table: 'MyTable',
    region: 'us-east-1',
    primaryKey: 'pk',
    sortKey: 'sk',
})
Emitting Metric Data
You can emit metrics via the emit API:
await metrics.emit('Acme/Metrics', 'launches', 10)
This will emit the launches metric in the Acme/Metrics namespace with the value of 10.
A metric can have dimensions that are unique metric values for specific instances. For example, we may want to count the number of launches for a specific rocket.
await metrics.emit('Acme/Metrics', 'launches', 10, [
    {rocket: 'saturnV'}
])
The metric will be emitted for each dimension provided. A dimension may have one or more properties. A metric can also be emitted for multiple dimensions.
If you want to emit a metric over all dimensions, you can add {}. For example:
await metrics.emit('Acme/Metrics', 'launches', 10, [
    {},
    {rocket: 'saturnV'}
])
await metrics.emit('Acme/Metrics', 'launches', 10, [
    {},
    {rocket: 'falcon9'}
])
This will emit a metric that is a total of all launches for all rocket types.
Query Metrics
To query a metric, use the query method:
let results = await metrics.query('Acme/Metrics', 'speed', {
    rocket: 'saturnV'
}, 86400, 'max')
This will retrieve the speed metric from the Acme/Metrics namespace for the {rocket == 'saturnV'} dimension. The data points returned will be the maximum speed measured over the day’s launches (86400 seconds).
This will return data like this:
{
    "namespace": "Acme/Metrics",
    "metric": "launches",
    "dimensions": {"rocket": "saturnV"},
    "spans": [{
        "end": 946648800,
        "period": 300,
        "samples": 10,
        "points": [
            { "sum": 24000, "count": 19, "min": 1000, "max": 5000 },
        ]
    }]
}
If you want to query the results as a single value over the entire period (instead of as a set of data points), set the accumulate options to true.
let results = await metrics.query('Acme/Metrics', 'speed', {
    rocket: 'saturnV'
}, 86400, 'max', {accumulate: true})
This will return a single maximum speed over the last day.
To obtain a list of metrics, use the getMetricList method:
let list: MetricList = await metrics.getMetricList()
This will return an array of available namespaces in list.namespaces.
To get a list of the metrics available for a given namespace, pass the namespace as the first argument.
let list: MetricList = await metrics.getMetricList('Acme/Metrics')
This will return a list of metrics in list.metrics. Note: this will return the namespaces and metrics for any namespace that begins with the given namespace. Consequently, all namespaces should be unique and not be substrings of another namespace.
To get a list of the dimensions available for a metric, pass in a namespace and metric.
let list: MetricList = await metrics.getMetricList('Acme/Metrics', 'speed')
This will also return a list of dimensions in list.dimensions.
Metrics Tenants
You can scope metrics by chosing unique namespaces for different applications or services, or by using various dimensions for applications/services. This is the preferred design pattern.
You can also scope metrics by selecting a unique owner property via the CustomMetrics constructor. This property is used, in the primary key of metric items. This owner defaults to ‘default’.
const cartMetrics = new CustomMetrics({
    owner: 'cart',
    table: 'MyTable',
    primaryKey: 'pk',
    sortKey: 'sk',
})
References
Participate
All feedback, discussion, contributions and bug reports are very welcome.
SenseDeep
SenseDeep can be used to view CustomMetrics graphs and data. You can also create alarms and receive alert notifications based on CustomMetric data expressions.
Contact
You can contact me (Michael O’Brien) on Twitter at: @mobstream, and read my Blog.
Try SenseDeep
Start your free 14 day trial of the SenseDeep Developer Studio.

Messages are moderated.
Your message will be posted shortly.
Your message could not be processed at this time.
Error: {{error}}
Please retry later.
{{comment.name || 'Anon'}} said ...
{{comment.message}}