SenseDeep — Beautiful Metrics
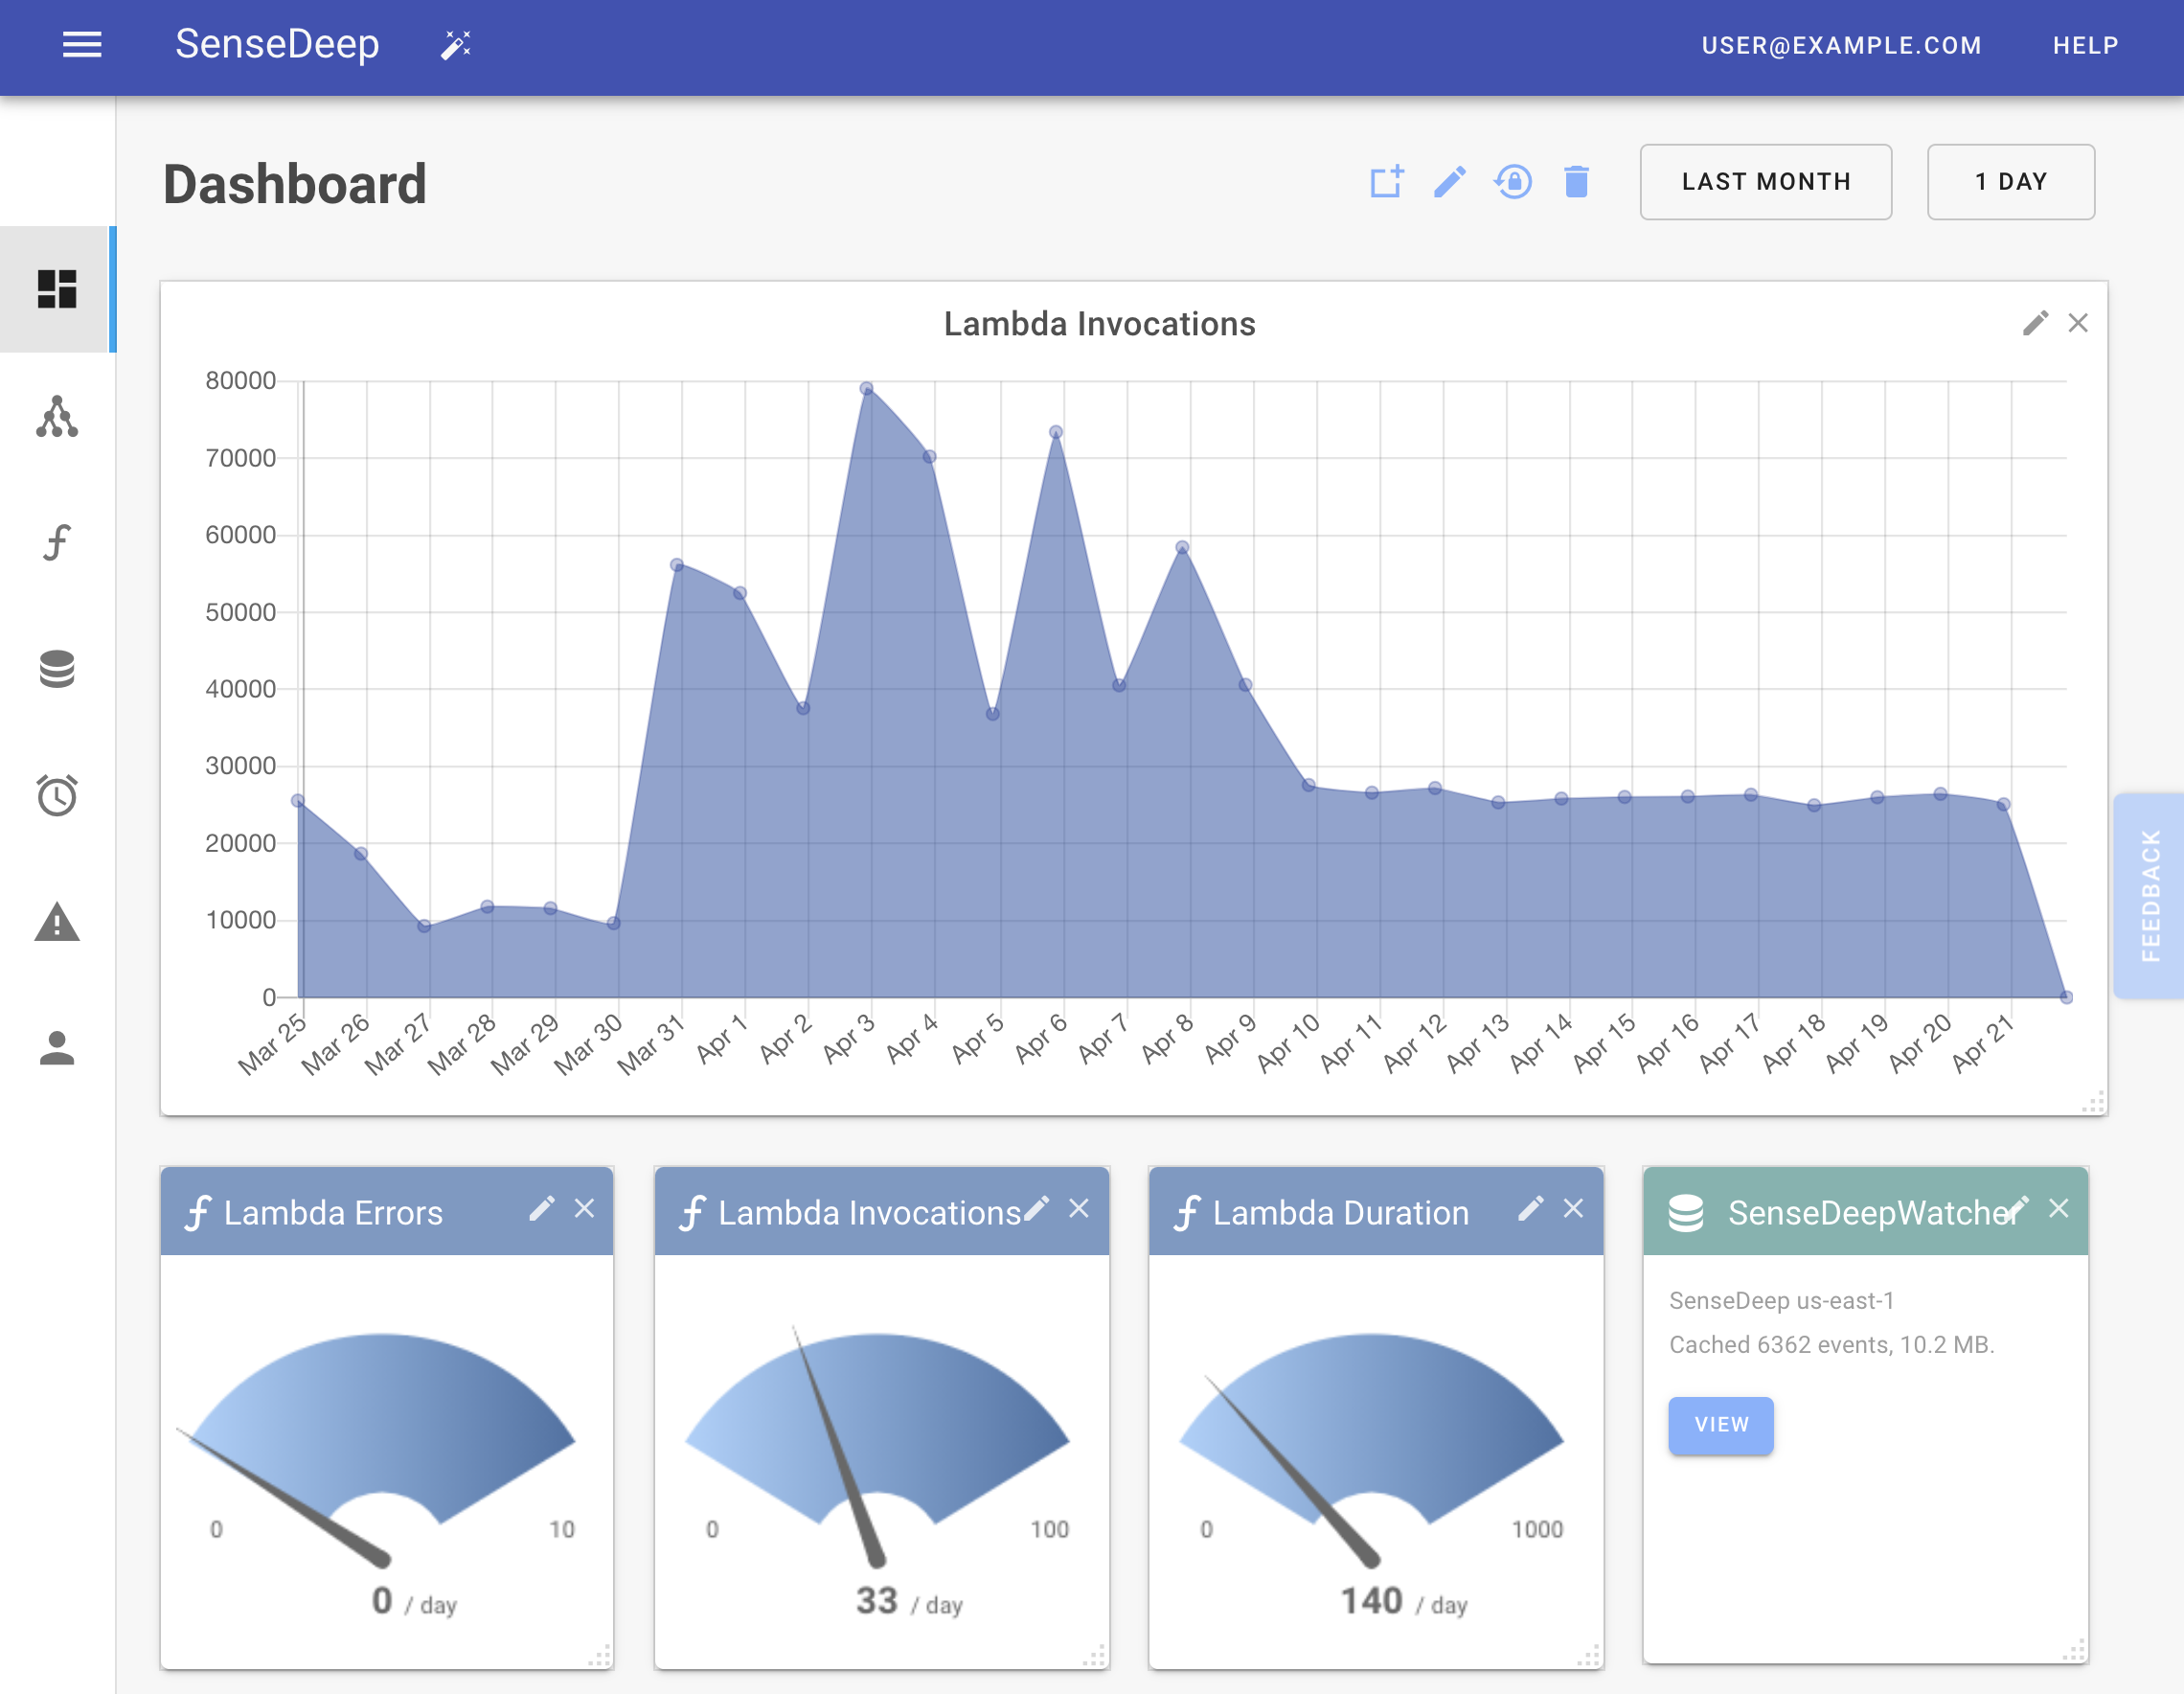
SenseDeep offers a highly visual and customizable dashboards so you can see your most critical serverless metrics and data at a glance.
Dashboards host informational widgets that connect to AWS CloudWatch metrics. Support is provided for all AWS services publishing metrics and for custom application metrics. In this way you can use SenseDeep dashboards for core AWS services and for monitoring the performance of your internal application functions.
The SenseDeep Dashboard includes:
- Graphical widgets including: graphs, gauges, numeric and text widgets.
- Customizable dashboard layout and widget positioning sizing.
- Responsive design for varying screen sizes.
- Ability to create multiple dashboards focussing on different service aspects.
- Extend from a gallery of additional widgets and data sources.
- Large library of pre-configured widget sets that focus on different AWS services.
- Save and share dashboard layouts with organization team members.
Widgets
The SenseDeep dashboard provides a variety of widget types:
- Graphs
- Gauges
- Numeric Widgets
- Text Widgets
- Lambda Widgets
- Log Widgets
- Dashboard Widgets
- Top alert widget
Graphs
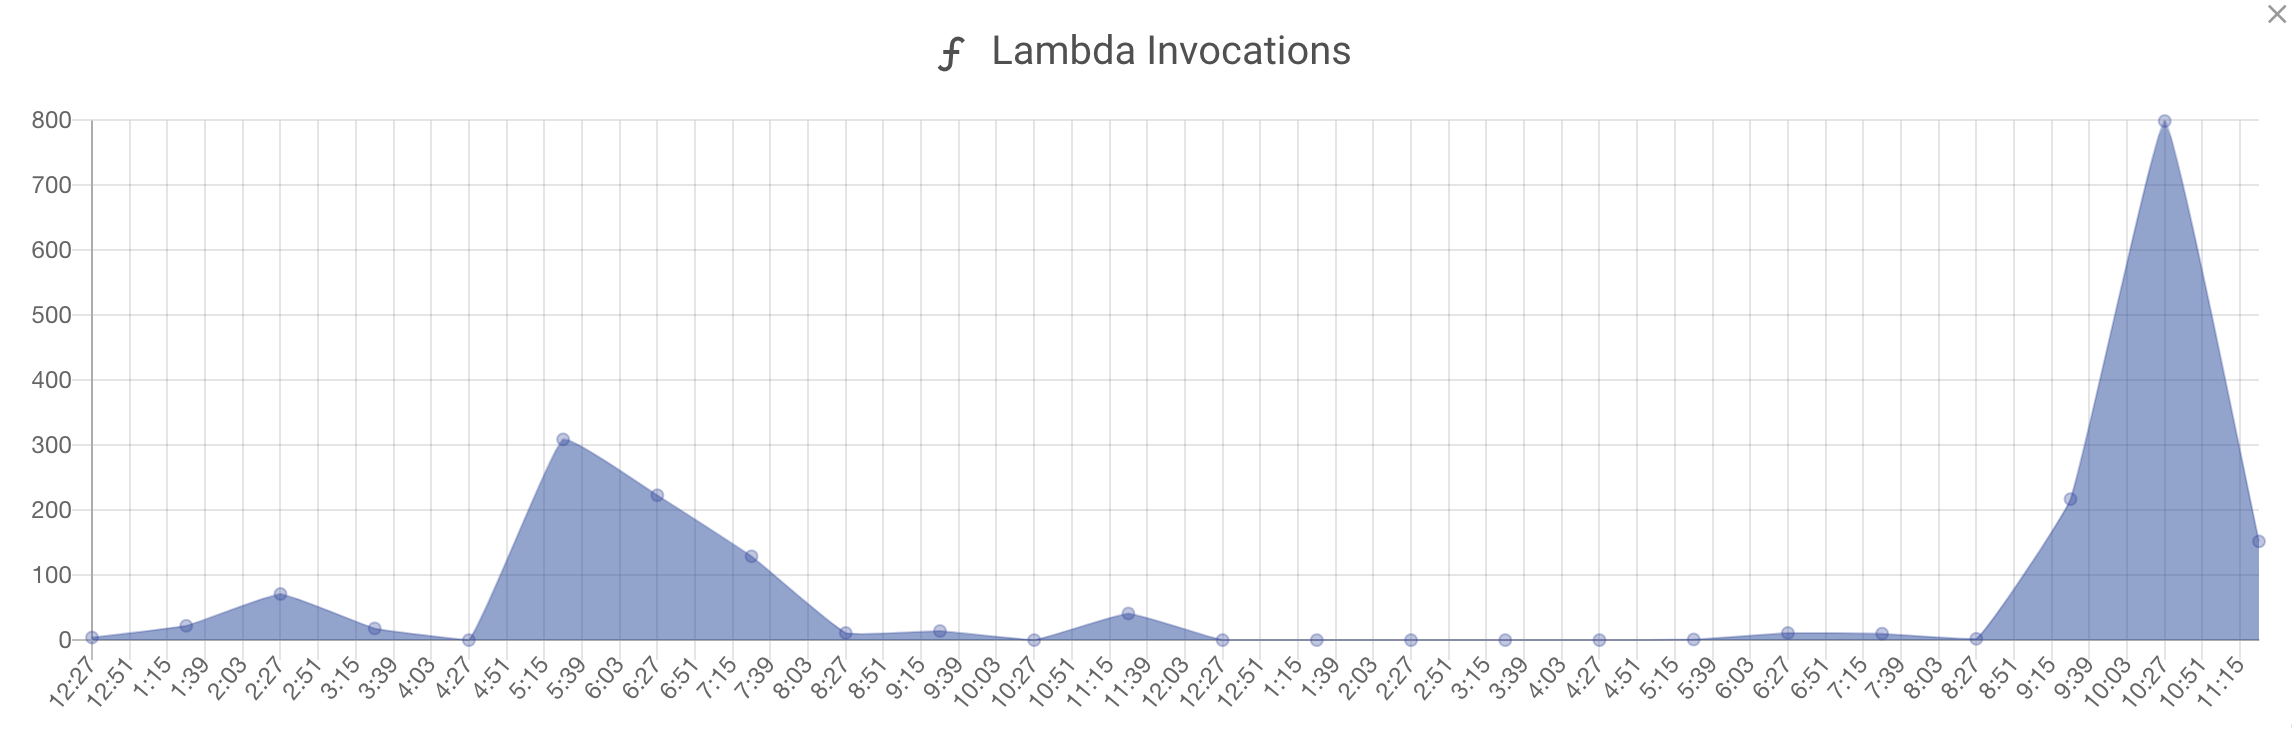
The graph is a time line view of a Lambda metric such as the number of function invocations, errors or function concurrency. You can change the graph title, data source and time range.
Gauges
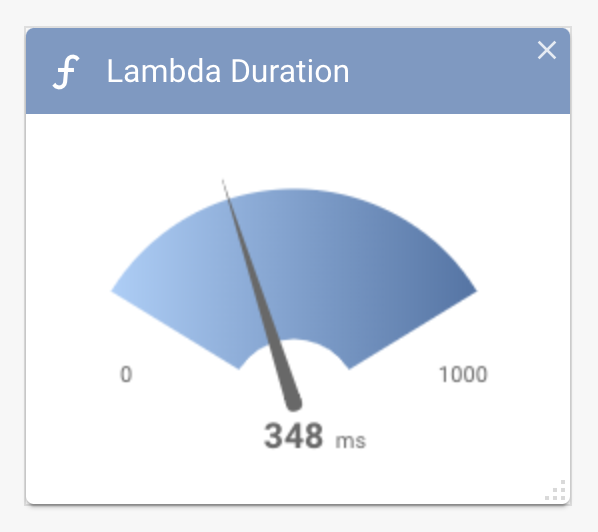
Gauge widgets display a total, average or maximum/minimum metric unit value over the most recently sampled interval period.
Log and Lambda Views
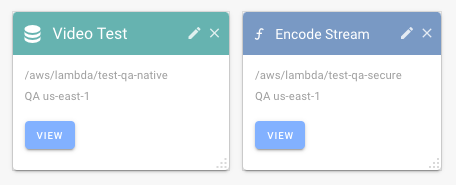
View widgets are a link to display Lambda function details or CloudWatch log groups.
The view widgets display the log group name and the Cloud name and region.
View widgets in blue are for Lambda functions and will link to the Lambda details page. The teal view widgets link to the SenseDeep CloudWatch logs viewer.
Adding Widgets
To add widgets to the dashboard, click on the Add Widget icon which will display the add widget slide-out panel.
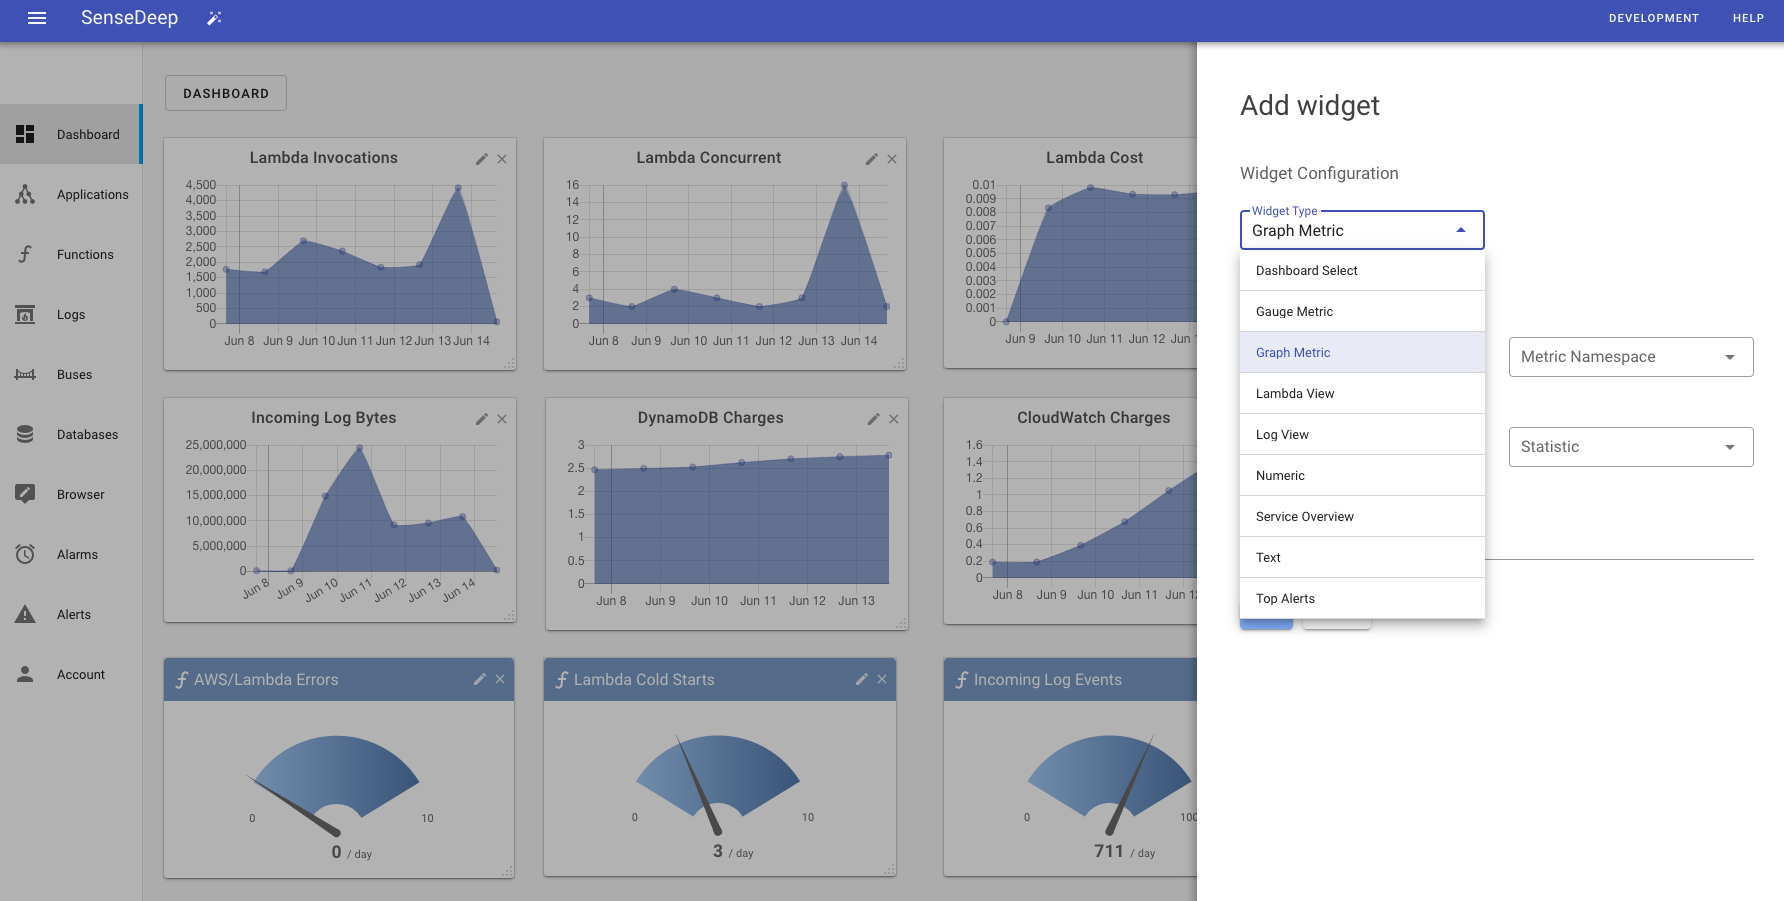
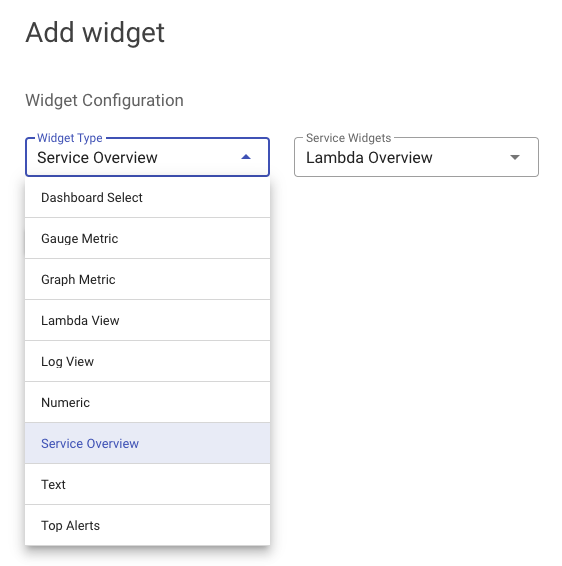
From this panel, you can select your widget type and the wizard will then prompt for the required fields.
If you select a service overview, you can choose from overviews for AWS billing, CloudWatch, DynamoDB, EventBridge, Lambda, SES or SNS.
If you select to create a graphical widget, you can connect to a metric data source from AWS, SenseDeep or any custom metric.
Automatic Layout
When you first display the dashboard, SenseDeep will perform a default layout of the widgets. However, you can perform a layout reset at anytime via the “Reset” icon.

Clicking the reset icon will restore the layout to the previously saved layout.
Manual Layout
You can move widgets by clicking on the title area and dragging the widget to a new position. The SenseDeep dashboard area has an alignment grid of 20 pixels to make it easier to align widgets.
You can resize widgets by clicking and dragging the bottom left widget resize handle to achieve the desired size.
When a widget is moved or resized, it also is moved to the top of the vertical stack of widgets. This will be noticeable if you have overlapping widgets.
You can remove a widget from dashboard by clicking on the (x) icon in the top left of the widget.
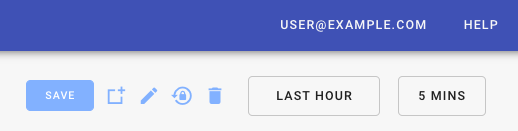
Save Dashboard
Whenever you make a change to the dashboard layout or widgets, you will be given the option to save the new layout via a top “Save” button. Clicking save will make this layout, the new default when you revisit the dashboard or whenever team-members display the dashboard.
If you make changes without clicking save, they will not be persisted or shared. The enables you to temporarily resize or maximize widgets to explore metrics without jeopardizing the default layout.
Responsive Design
The SenseDeep dashboard is responsive by design. As you resize the browser, the widget proportions will be maintained wherever possible.
Metric Time Range
You can specify the time duration for metrics via the Date / Time selection menus at the top of the dashboard.
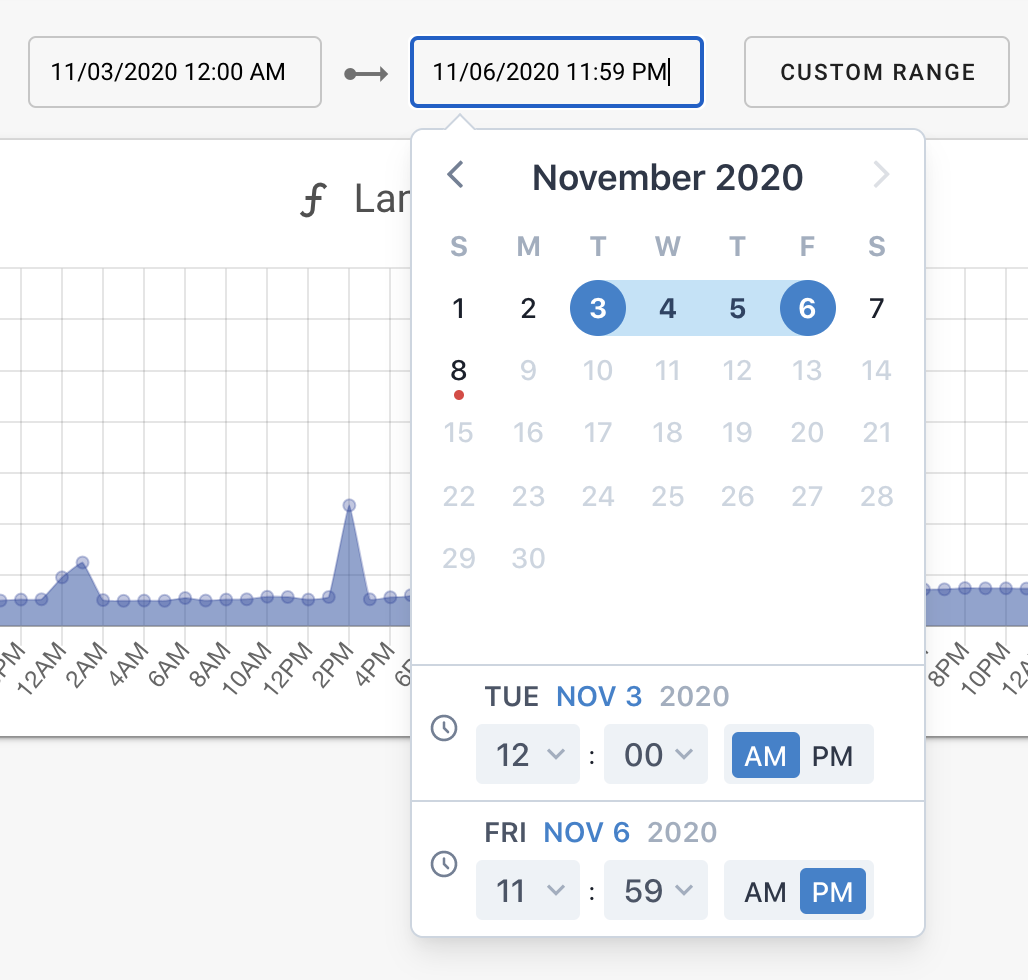
You can select “Last hour”, day, week, month or custom date range.
Creating and Selecting Dashboards
You can create multiple dashboards that focus on different service aspects. For example, you may want a dashboard that features service load graphs and metrics and another dashboard to focus on outages and errors.
You can easily switch between dashboards by clicking on the name of the dashboard in the top left of the home page.
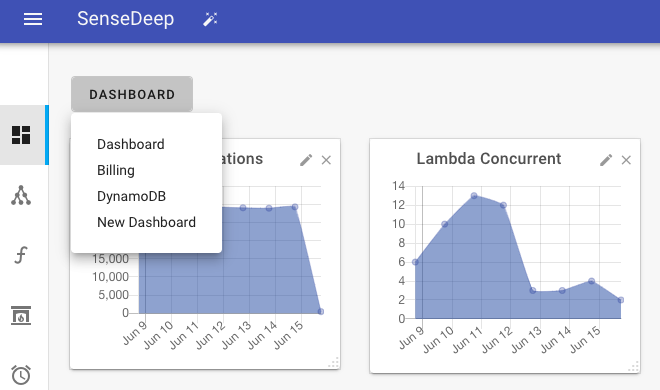
Select “New Dashboard” to display the “Select dashboard” slide out panel. Select “New Dashboard” and then enter your desired dashboard name.
You can also create a dashboard switch widget that lets you rapidly switch to another dashboard.
Summary
SenseDeep dashboards are flexible informational viewports onto your service. We plan to extend the dashboard feature over the next year to permit more customization and flexibility. Please let us know if there is a particular feature you would like us to add to the SenseDeep dashboards.
Try SenseDeep
Start your free 14 day trial of the SenseDeep Developer Studio.

Messages are moderated.
Your message will be posted shortly.
Your message could not be processed at this time.
Error: {{error}}
Please retry later.
{{comment.name || 'Anon'}} said ...
{{comment.message}}