SenseDeep DynamoDB Observability
I’m happy to announce exciting new DynamoDB capabilities in SenseDeep to give you deep insights and observability into your DynamoDB single table designs.
This release breaks new ground with detailed metrics and visualizations for your DynamoDB implementations.
Best practices for DynamoDB have evolved to favor single-table patterns where one database table serves the entire application and holds multiple different application entities. But there is a dearth of tools to support single-table designs.
Previously, single-table designs with DynamoDB has been a black box and it has been difficult to peer inside and see how the components of your design are operating.
This release has new unique capabilities for single-table design patterns that unlock the hidden inner workings of your DynamoDB designs.
DynamoDB Observability
The new release of SenseDeep offers the following DynamoDB features:
- Discovery of your DynamoDB tables in connected clouds and regions.
- Single-table designer to create schemas and models for single-table designs.
- Per-table statistics and metrics tracking table size and number of items stored.
- Single-table item-level metrics for Tables, Invoking functions, Indexes, Entities and Operations.
- Per-query statistics and metrics. Profile individual queries in your serverless apps.
- Visualizations for account level DynamoDB utilization and limits.
- Operation metrics for DynamoDB API calls per table.
The SenseDeep DynamoDB suite also includes:
- Data browser for table items that is single-table aware.
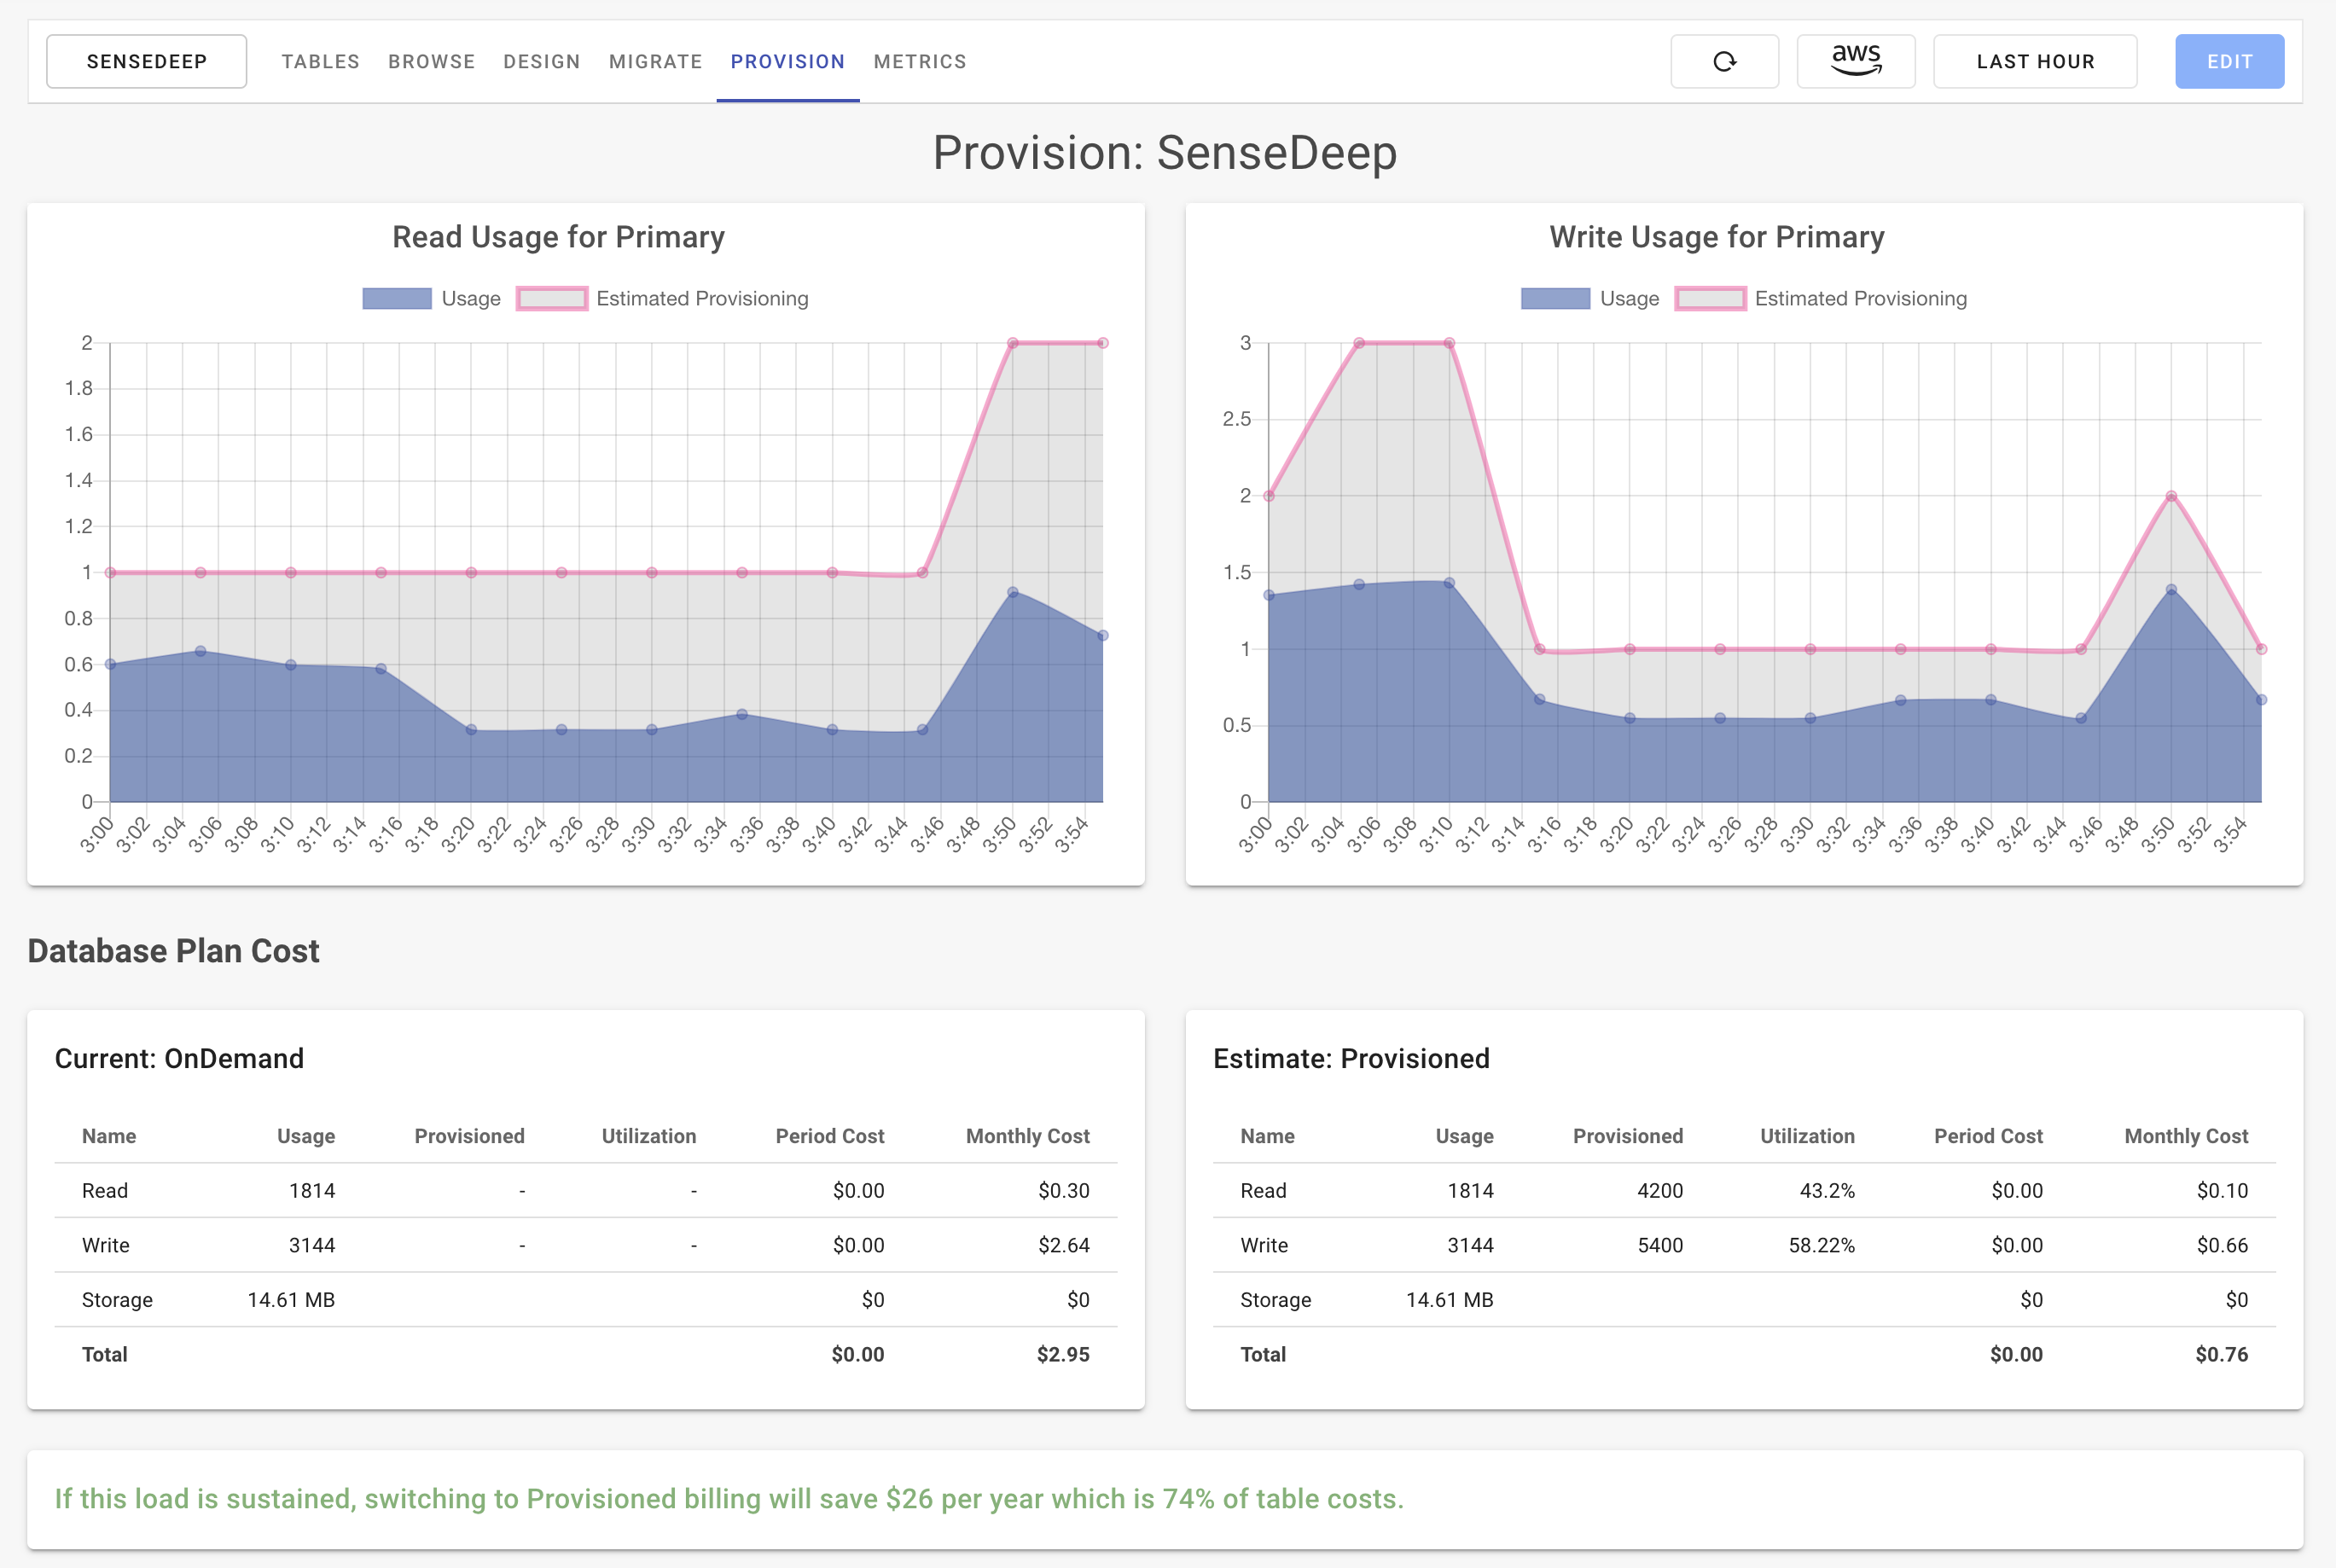
- Provisioning and capacity planning visualizations and metrics.
- Migration manager to sequence your database upgrade and downgrade migrations.
- Table manager to quickly create tables and indexes during development.
The scalable single-table metrics permit drill-down from the Table level down to the application entity with aggregated metrics for each level.
So what are the kinds of DynamoDB questions can SenseDeep answer?
- Which single-table entity/model is causing the most load and is consuming the most RCU or WCU?
- Which customer tenant is causing the most load and how much should they be billed?
- Which app or function is causing what percentage of load on DynamoDB and is consuming the most RCU or WCU?
- Which queries are the most inefficient (items vs scanned) and by which app or model?
- Which operations are being used the most?
- Which entity is using performing scans or other operations?
These questions and others are now easily answered.
Table Manager
In the side-menu, you’ll see the new option for Databases. This option displays the SenseDeep table manager with a list of DynamoDB tables.
SenseDeep will automatically discover your tables and will dynamically update this list as new tables are created or destroyed. The table list includes the table size, number of items, billing scheme and provisioned capacity.
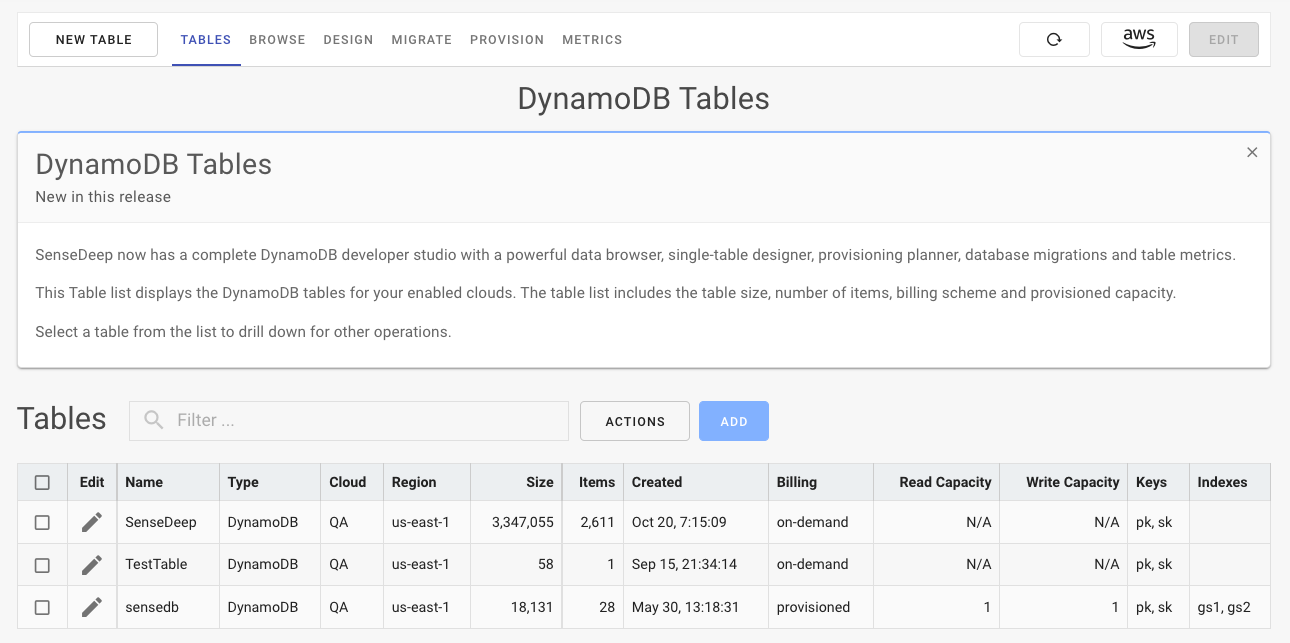
SenseDeep manages the DynamoDB tables for your enabled clouds. These tables can be in multiple AWS accounts or regions. You can create and delete tables and indexes for your tables.
The SenseDeep table management is not meant to replace appropriate “infrastructure-as-code” deployment of tables to production. Rather, it intends to provide a quick and easy way to create and manage tables and indexes while developing your DynamoDB applications.
Metrics
From the Table Manager, select “Metrics” from the right side of the DynamoDB studio menu.
For any table, SenseDeep can display standard AWS DynamoDB metrics to show read and write usage with the provisioned capacity overlaid in red.
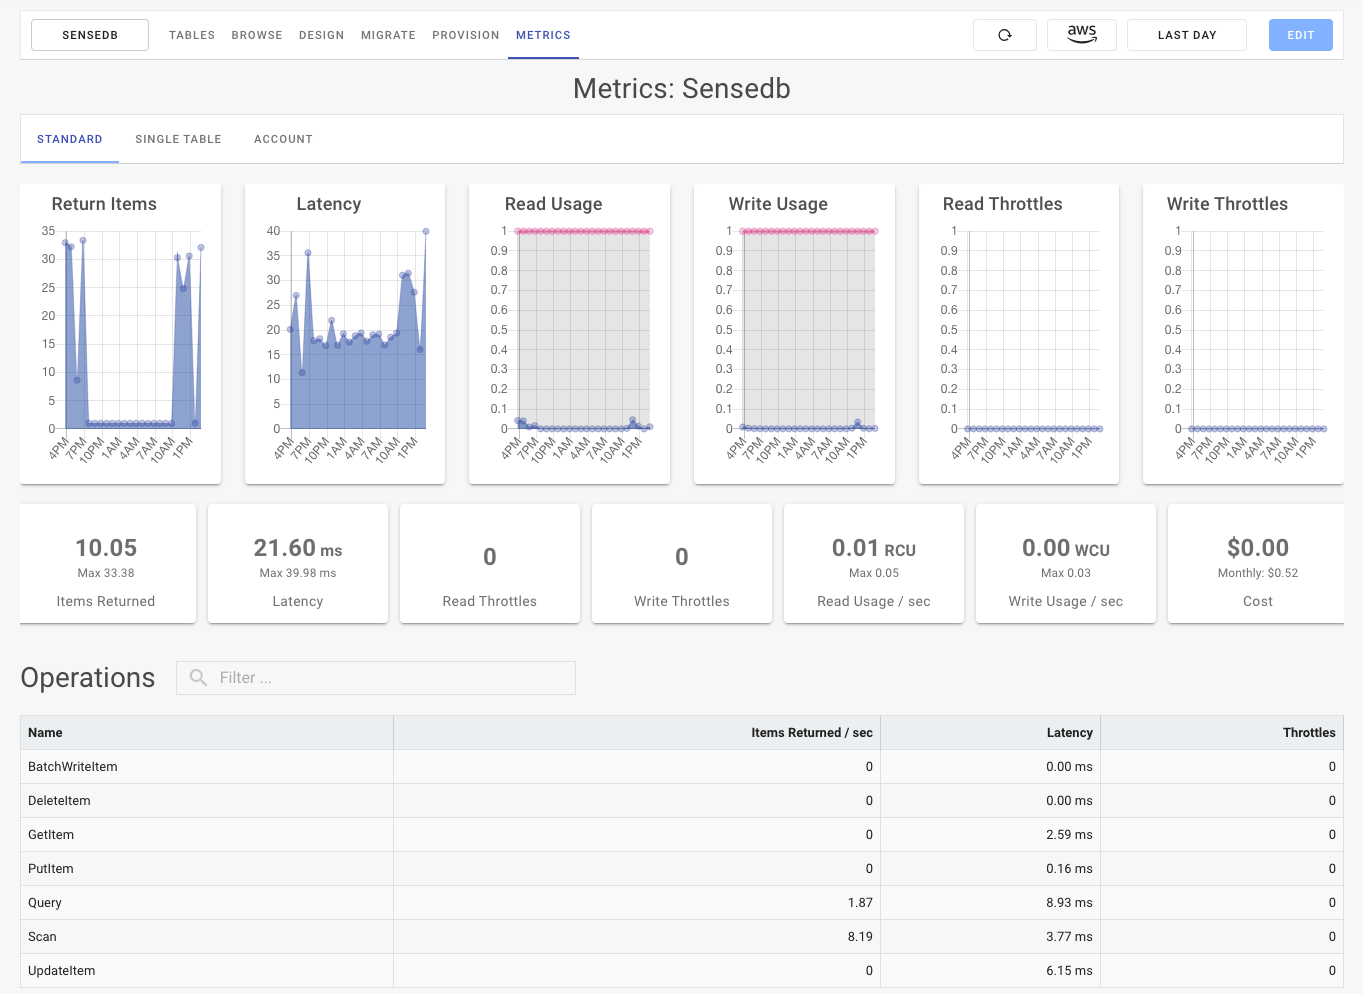
The per-operation stats are displayed in a table at the bottom.
Now, things get event more interesting if you enable single-table metrics.
Single-Table metrics
SenseDeep can display DynamoDB Metrics for single-table designs by using the enhanced metrics emitted by OneTable or DynamoDB Metrics.
These libraries capture and emit detailed single-table metrics that track requests at function, index, application entity and operation levels.
See Understanding Your DynamoDB Single-Table Performance to learn more.
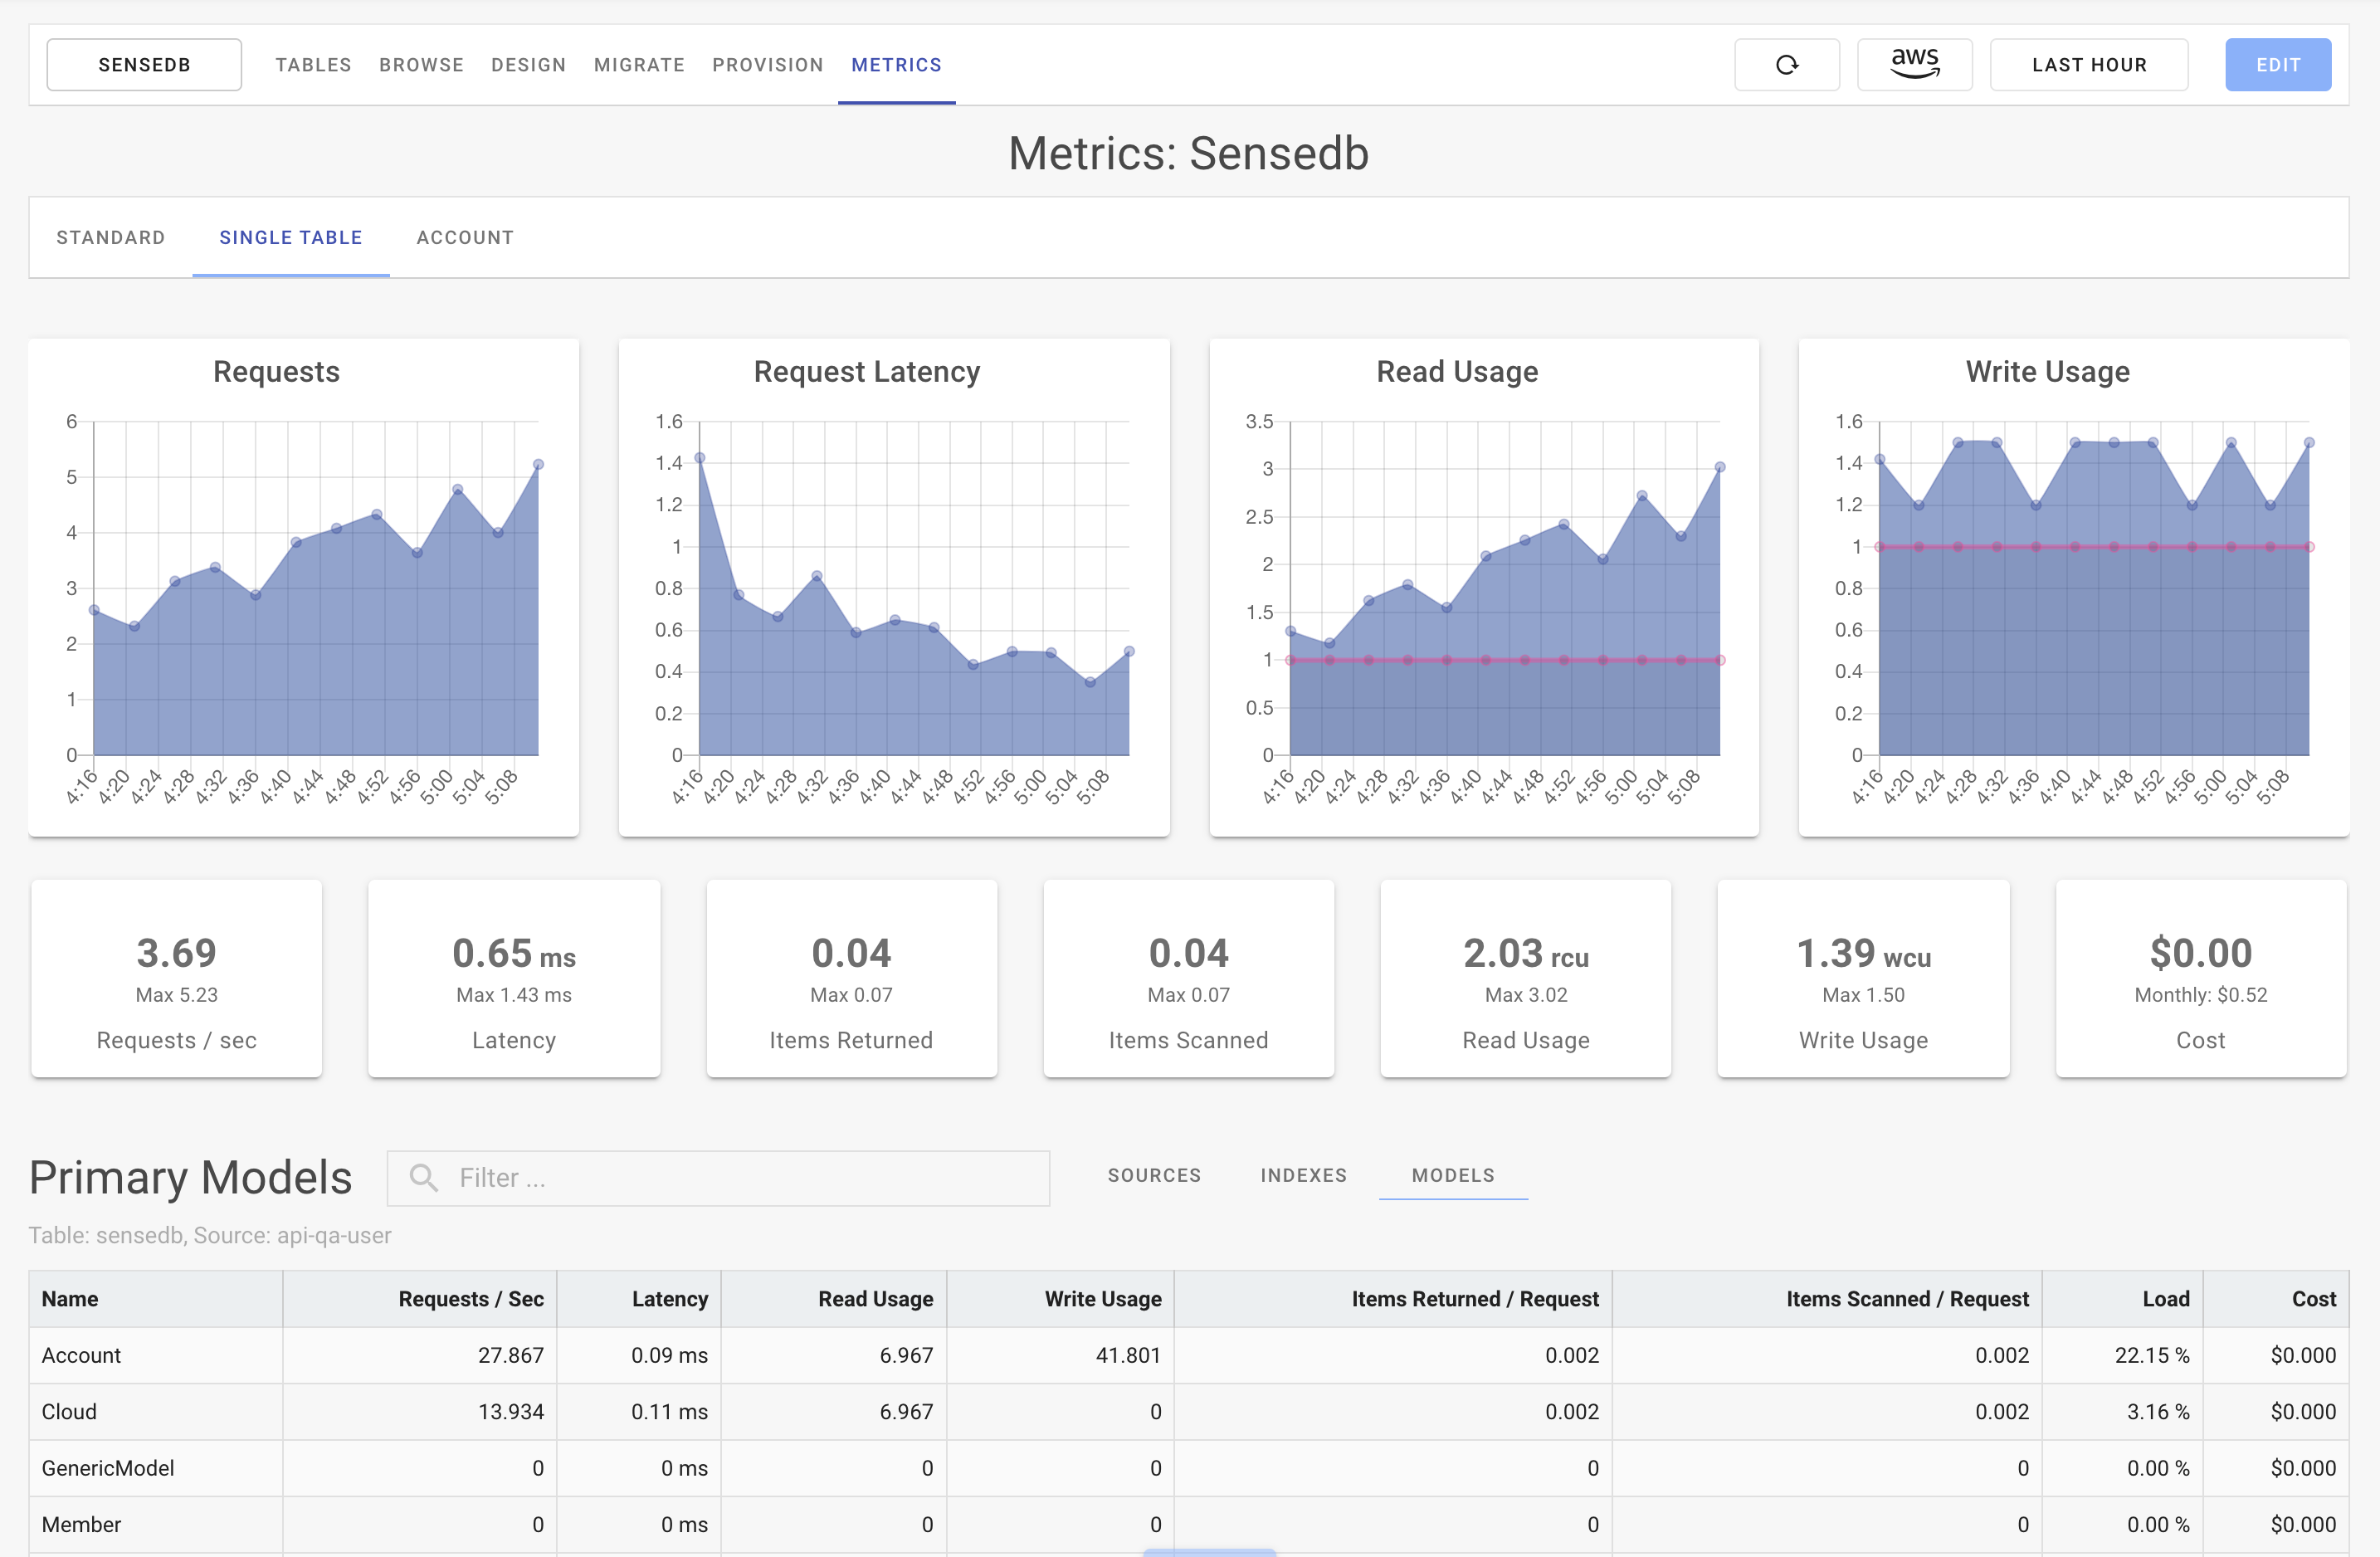
The SenseDeep single-table DynamoDB page displays metrics across 5 dimensions:
- Table — Per table metrics.
- Tenant — Per customer tenant metrics.
- Source — Per application, module or function identification.
- Index — Primary or global secondary index.
- Model — Application single-table entity / model name.
- Operation — DynamoDB low-level operation: GetItem, PutItem, etc.
You can drill-down through these dimensions to see metrics aggregated by table, tenant, source, index, model or operation. This enables you to pin-point exactly where performance issues may be lurking.
For each of these dimension combinations, SenseDeep displays the following metrics:
- read — Read capacity units consumed.
- write — Write capacity units consumed.
- latency — Aggregated request latency in milliseconds.
- count — Count of items returned.
- scanned — Number of items scanned.
- requests — Number of API requests issued.
With these metrics, you can see precisely who is consuming read and write capacity, which requests are running long, and which requests are inefficient and are scanning the table.
Enabling Single Table Metrics
The best way to enable single-table metrics is to use the OneTable library that has metric support built-in. DynamoDB OneTable transforms single-table design patterns by providing an elegant, dry syntax while still enabling easy access to the full DynamoDB API. It works with AWS V2 and V3 SDKs for JavaScript and TypeScript apps.
Alternatively if you have an existing DynamoDB code base, you can use the DynamoDB Metrics library that captures and emits the same detailed DynamoDB metrics for existing code bases that use single-table designs.
Drill Down
On the Single-Table page, you can drill-down by clicking on any row in the table at the bottom of the page.
Initially, the table displays the Lambda functions or sources of the metrics. This enables you to see which application or function is loading your database table.
By clicking on a row, you can display metrics for the table primary and secondary indexes. Click again to display the application entities and so on.
As you drill-down, the graphs and metrics at the top of the page will display information for your selected choice.
Go back up the chain by clicking on the cookies to the right of the table filter box.
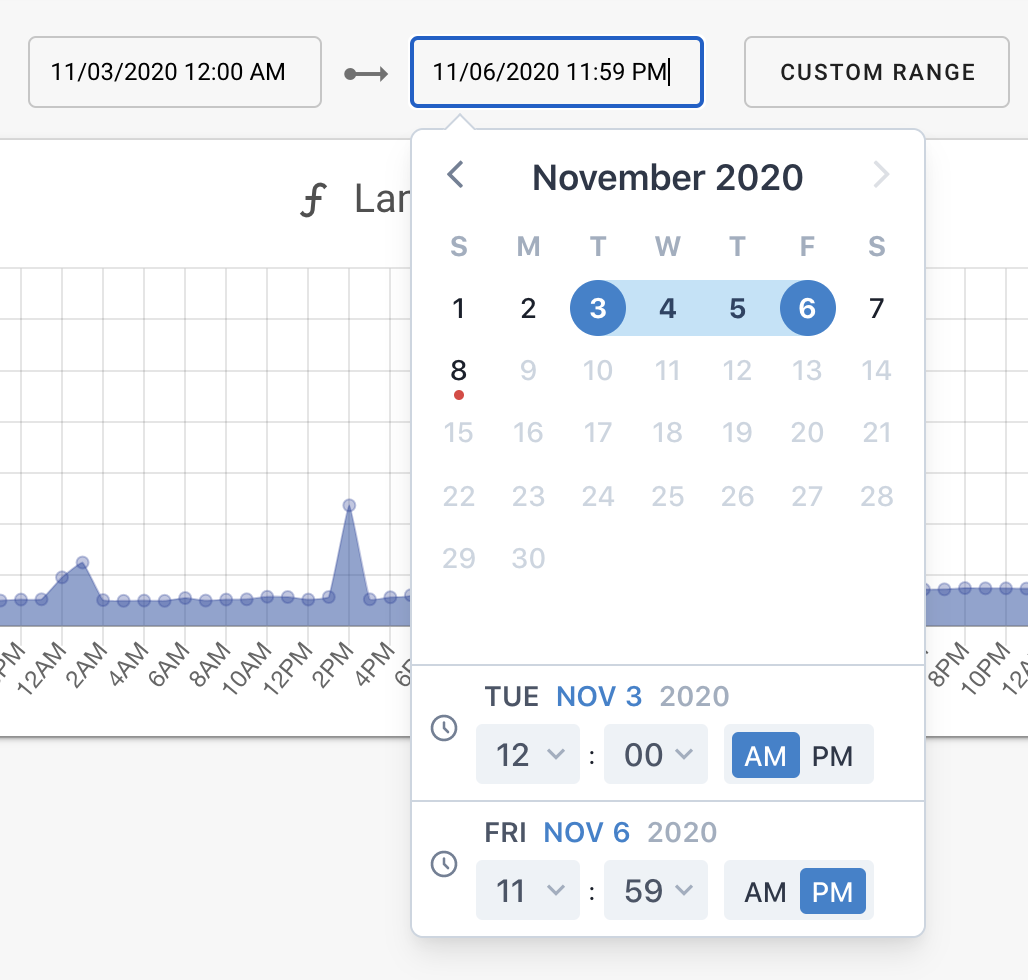
Selecting Time Periods
For any page, you can select the desired time range for your metrics. You can select last hour, day, week or month or any custom period.
DynamoDB Studio
The SenseDeep DynamoDB studio includes several other modules:
- Provisioning Planner — to calculate and monitor your table provisioning and billing.
- Data Browser — a single-table aware DynamoDB browser. Easily search and modify data.
- Single Table Designer — Create and manage single-table schema and models.
Under the Hood
The OneTable and DynamoDB Metrics libraries emits metrics using the CloudWatch EMF log-based metrics format. This permits zero-latency creation of metrics without impacting the performance of your Lambdas. EMF allows metrics to be emitted without blocking as would be the case with a normal blocking API.
Summary
Gaining insight into single-table design patterns is the new frontier for DynamoDB and we’ve got more exciting new capabilities coming soon for DynamoDB. Tell us if there is anything you’d like
You may also like to read:
Try SenseDeep
Start your free 14 day trial of the SenseDeep Developer Studio.

Messages are moderated.
Your message will be posted shortly.
Your message could not be processed at this time.
Error: {{error}}
Please retry later.
{{comment.name || 'Anon'}} said ...
{{comment.message}}