SenseDeep Documentation
SenseDeep is a Serverless monitoring and management solution that provides AWS cloud developers with a fast and effortless way to troubleshoot their Serverless applications in real-time and achieve true observability for their applications.
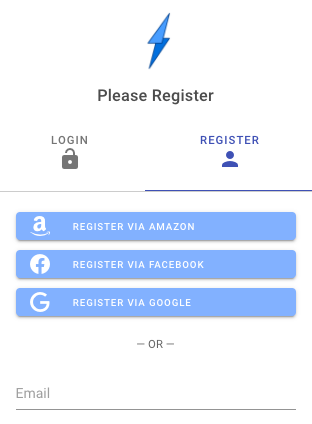
Getting Started
To start using SenseDeep, simply navigate to and register a new account. You can use your social login account if you wish.
This will run SenseDeep and will automatically create some sample logs and views for you to explore SenseDeep. Click on one of the view cards to launch a view of the sample log.
Connecting Your Serverless and Log Data
To view your Serverless functions and logs, you need to connect your AWS account to a SenseDeep Cloud. When connecting your AWS account, you can either enter AWS access keys or you can use the more secure AWS IAM role method.
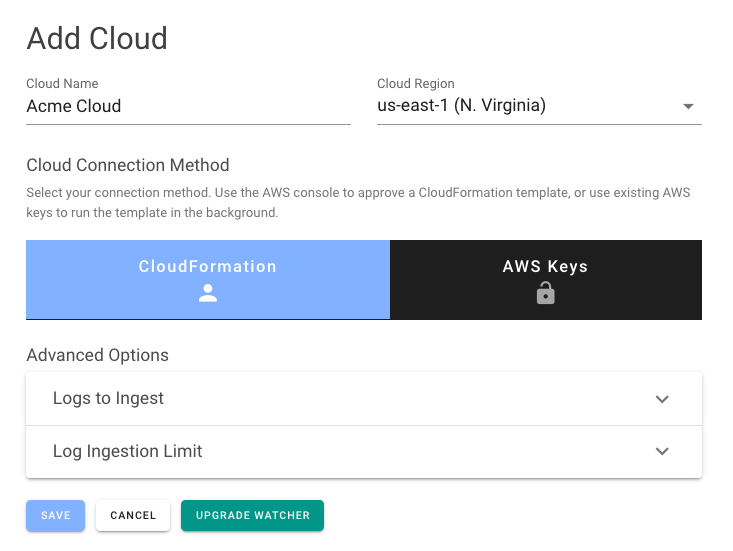
When you enter your cloud credentials, you must also enter the AWS region containing your logs.
Auto Discovery
Once your credentials are added, SenseDeep will quickly discover your Lambda functions and Log groups. These will be displayed in the Functions and Log Lists. If you have Lambda functions, the Lambda summary graphs will be displayed on your home page.
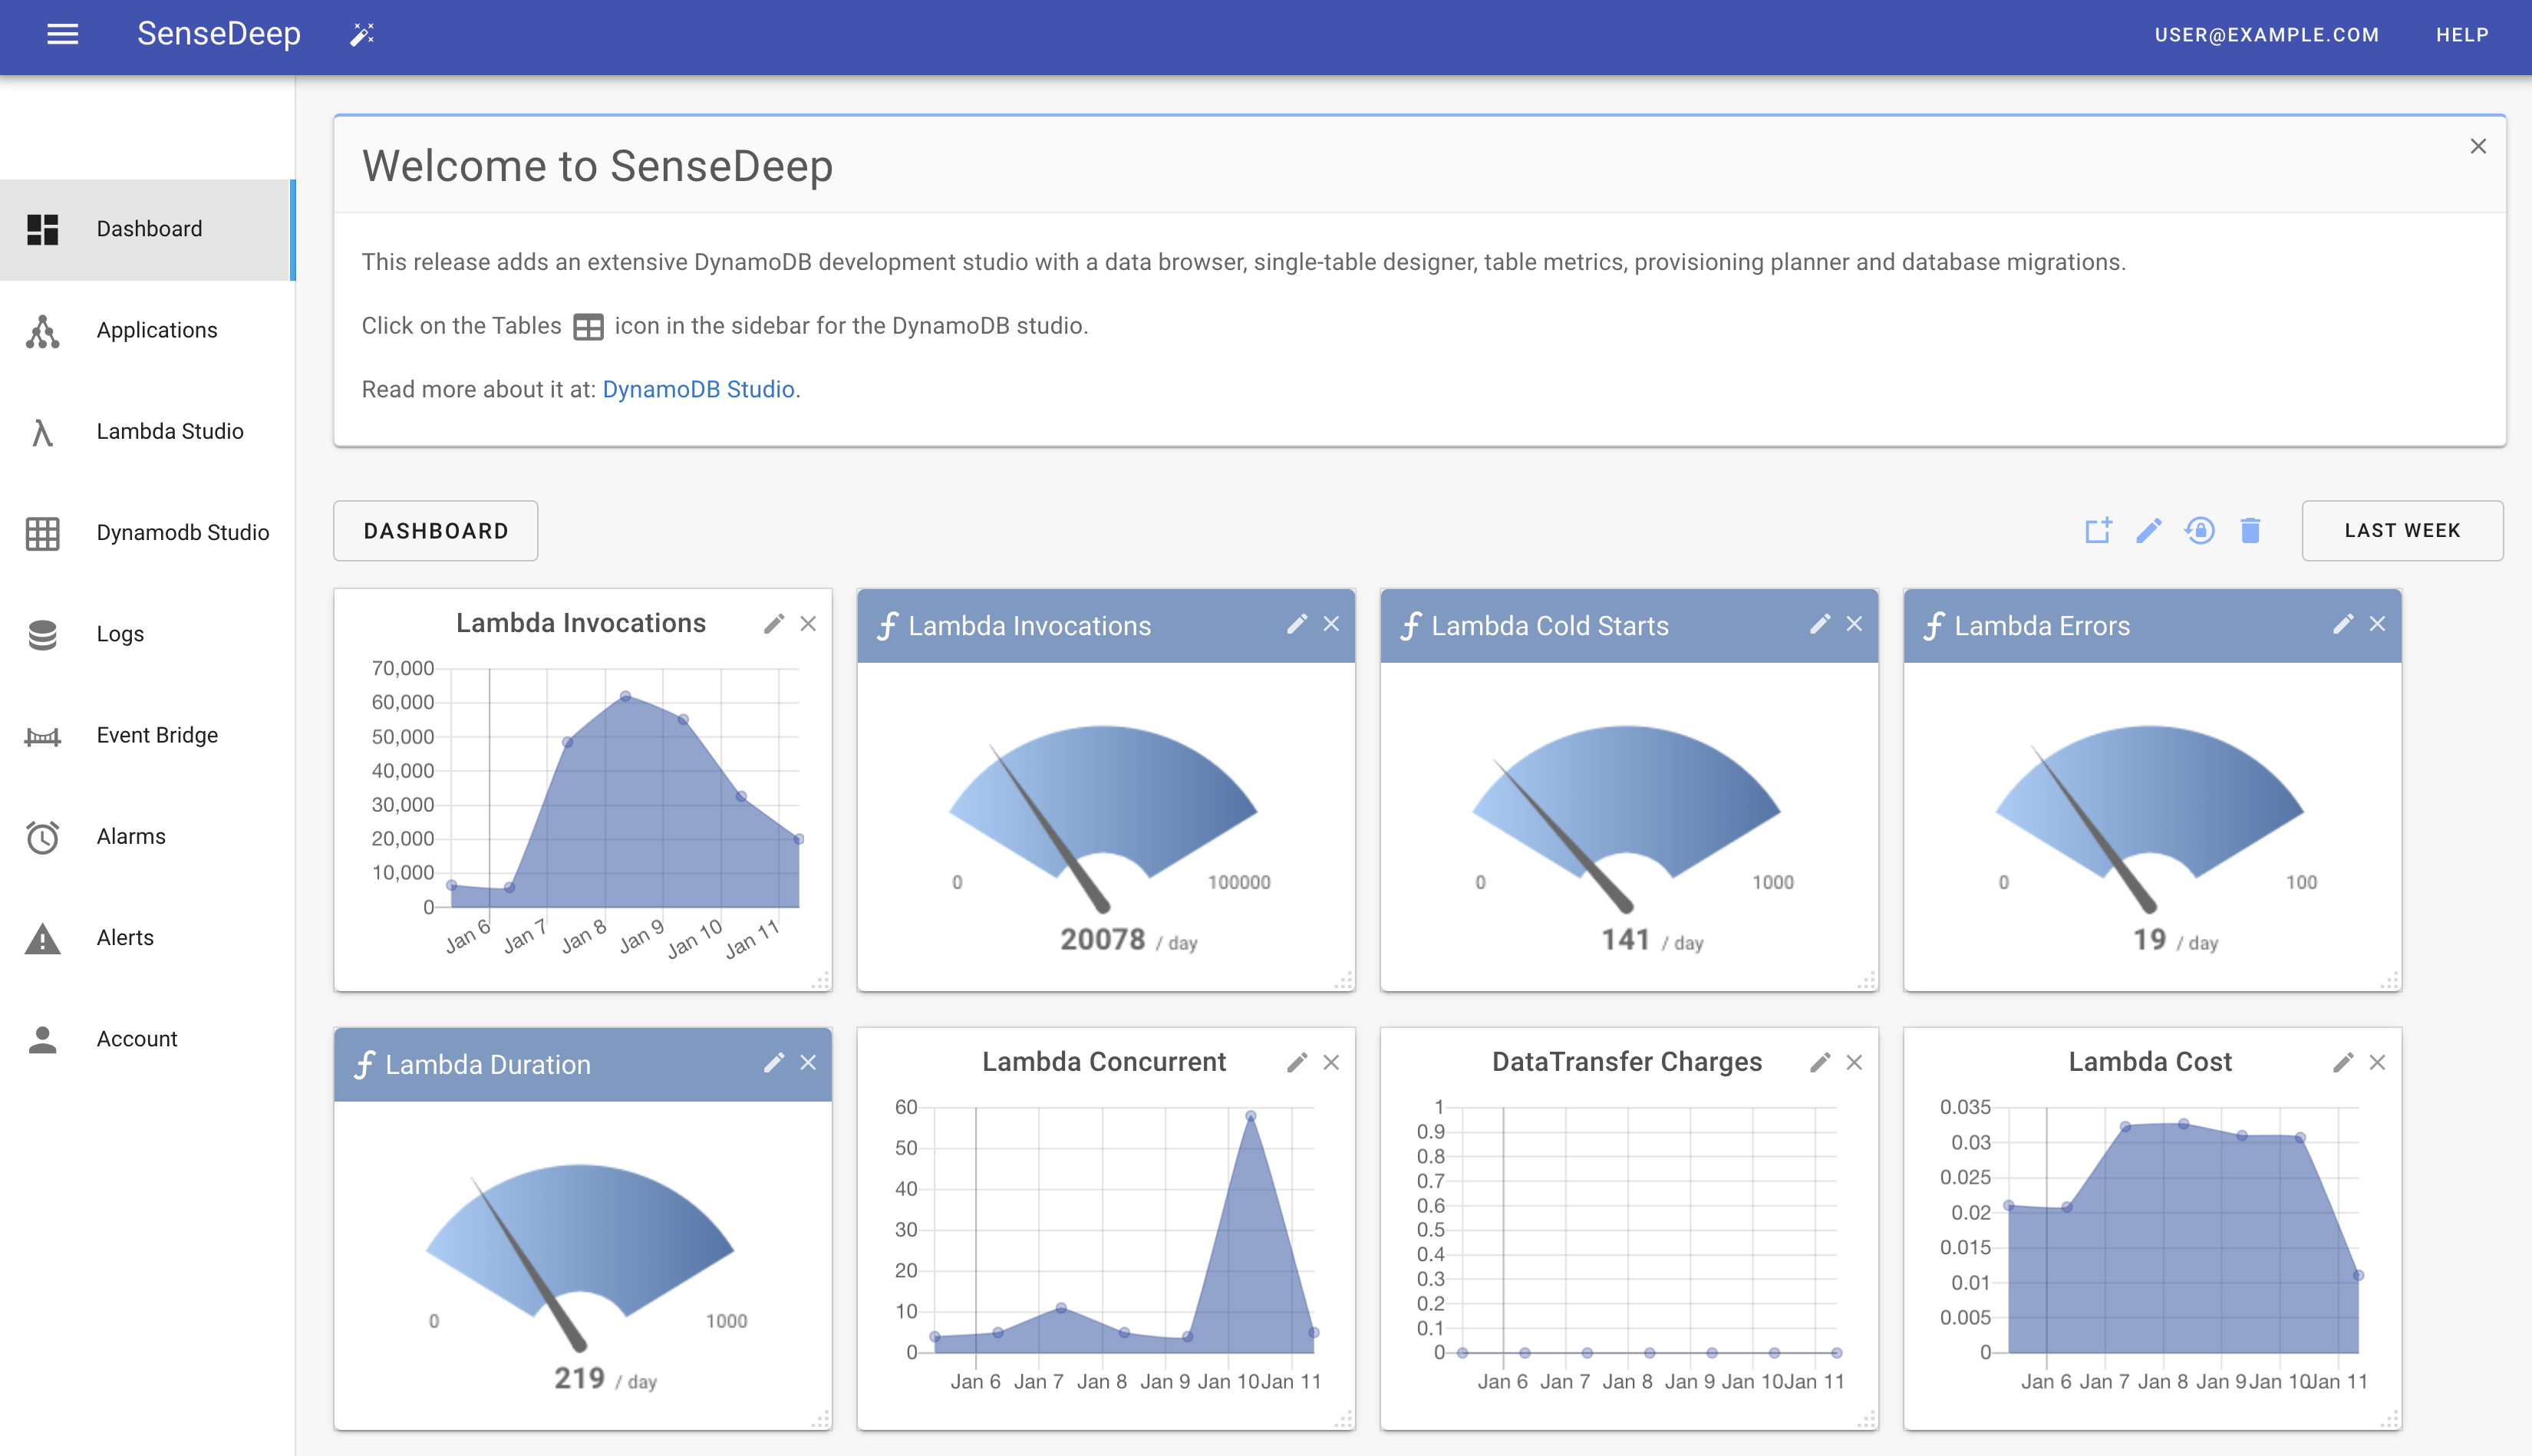
Dashboard
The SenseDeep dashboard is a highly customizable presentation of graphical widgets to display your most important Serverless metrics. It displays Lambda, log widgets and graphs and gauges.
View widgets can be resized and reordered to suit your preference. Dashboard layouts can be modified and saved to share with team members.
The Dashboard displays a subset of available widgets. A side-panel provides a gallery of additional widgets can be dragged to and from the dashboard as desired. When a view widget is dismissed, it is returned to the gallery.

At the top of the dashboard, three icons are provided for:
- Display the widget gallery
- Add a new view card for an AWS log group
- Soft and hard reset of the dashboard layout
Function List
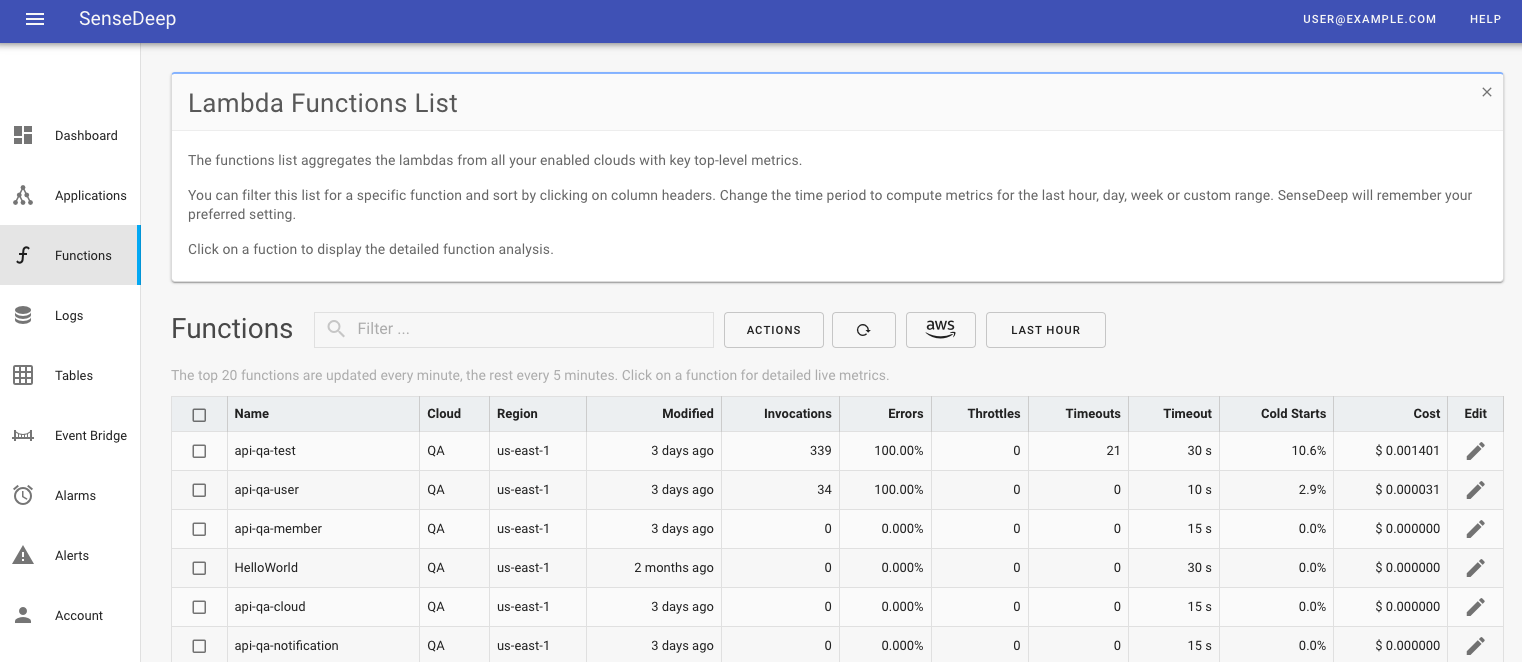
The Functions menu option displays a list of your Lambda functions and some high level function metrics.
Function details include the number of invocations (events), average function duration, the number of errors, cold starts, memory used and the estimated monthly cost of the function. These metrics are for the invocations sampled and cached in your browser. You can see metrics for other periods by clicking on a function to display the detailed function display.
From the list you can enable or disable detailed monitoring for the function by toggling the Monitor slider, or by selecting multiple functions and clicking the Toggle Monitor action.
Function Detail
Selecting a specific Lambda function from the function list will display detailed graphs and metrics for the function.
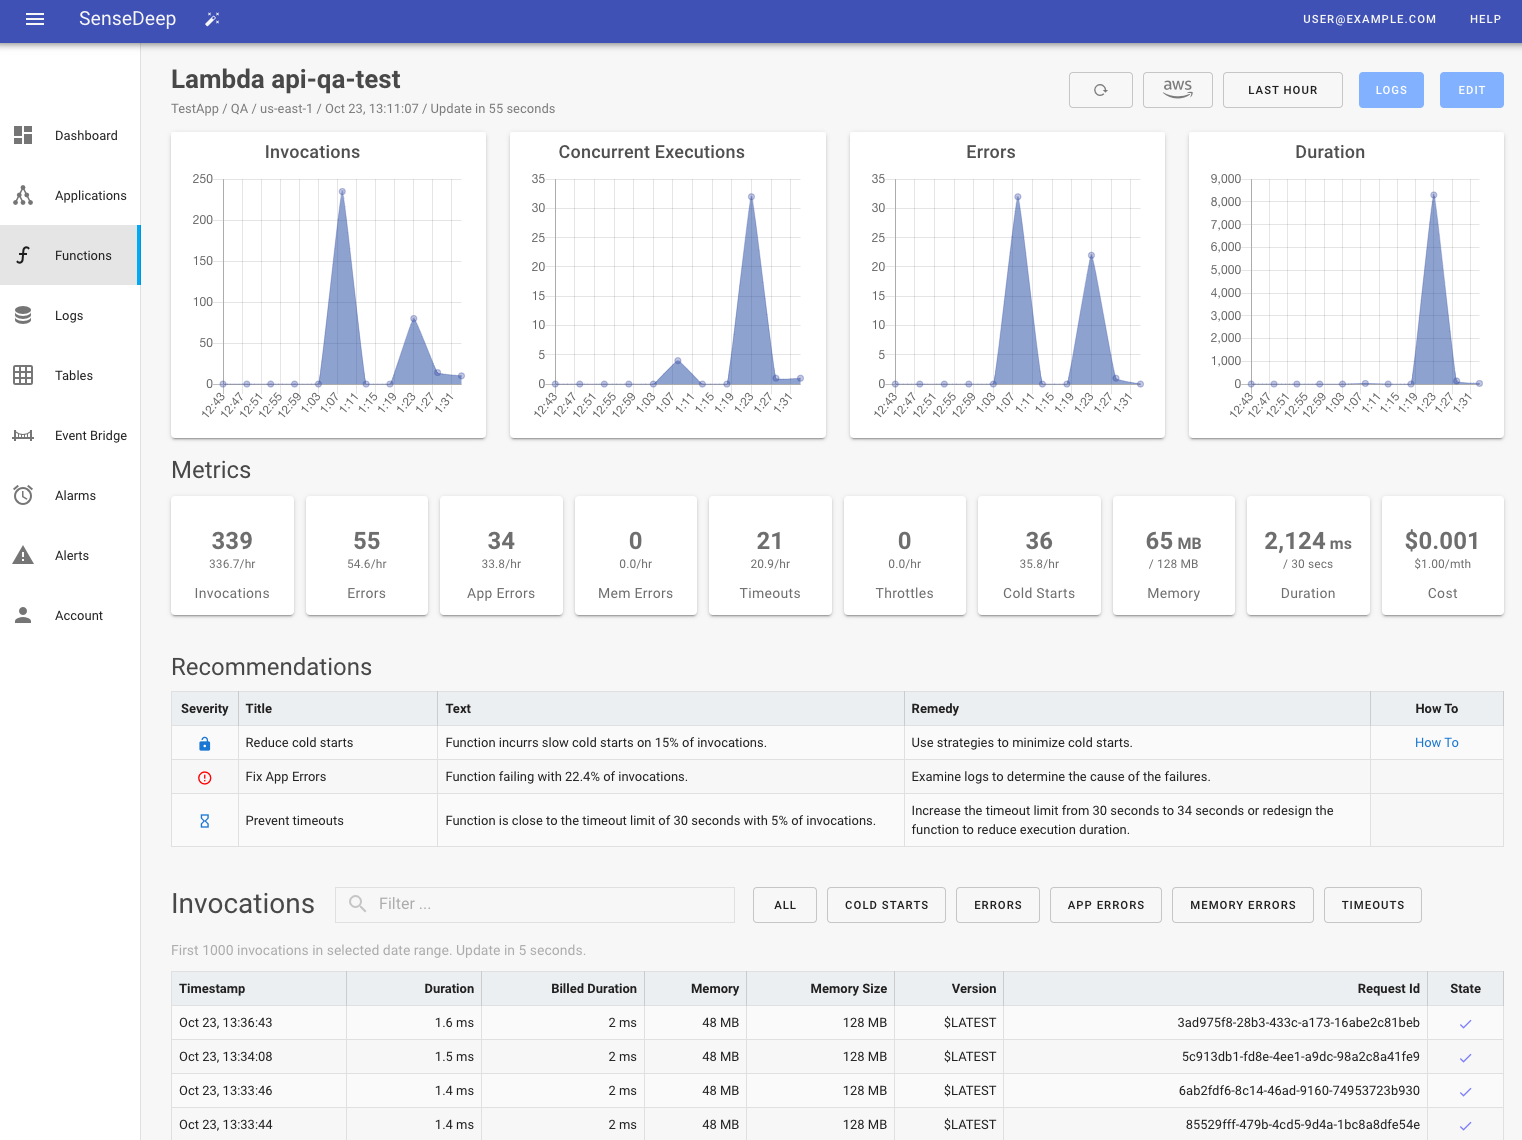
The graphs shows function performance including the number of invocations, concurrent executions, errors and the average duration. You can select the graphed period to be per hour, day, week, month or custom period using the period button at the top right. Next to that is the interval period which defines the metric sample size. You can set this to be 5 minutes, one hour or one day.
Below the graphs are recommendations to optimize the reliability and performance of your function. These recommendations are suggestions that you should validate are appropriate for your site. SenseDeep uses ML to select the recommendations that are most appropriate for your function. Some of the recommendations are:
- Increase or decrease the allocated memory
- Increase or decrease the function timeout
- Increase the reserved concurrency of the function
- Address cold starts to improve the user experience
- Reduce the function throttling by AWS
- Consider migrating from Lambda to EC2 for high load functions
Below the graphs are key performance indicators for the most recent period. These statistics include the number of cold starts and the estimated cost for the function per month.
Below the numeric widgets is a searchable list of function invocations ordered to put the most recent invocations at the top. Click on any invocation to display the full invocation details.
Full Invocation Details
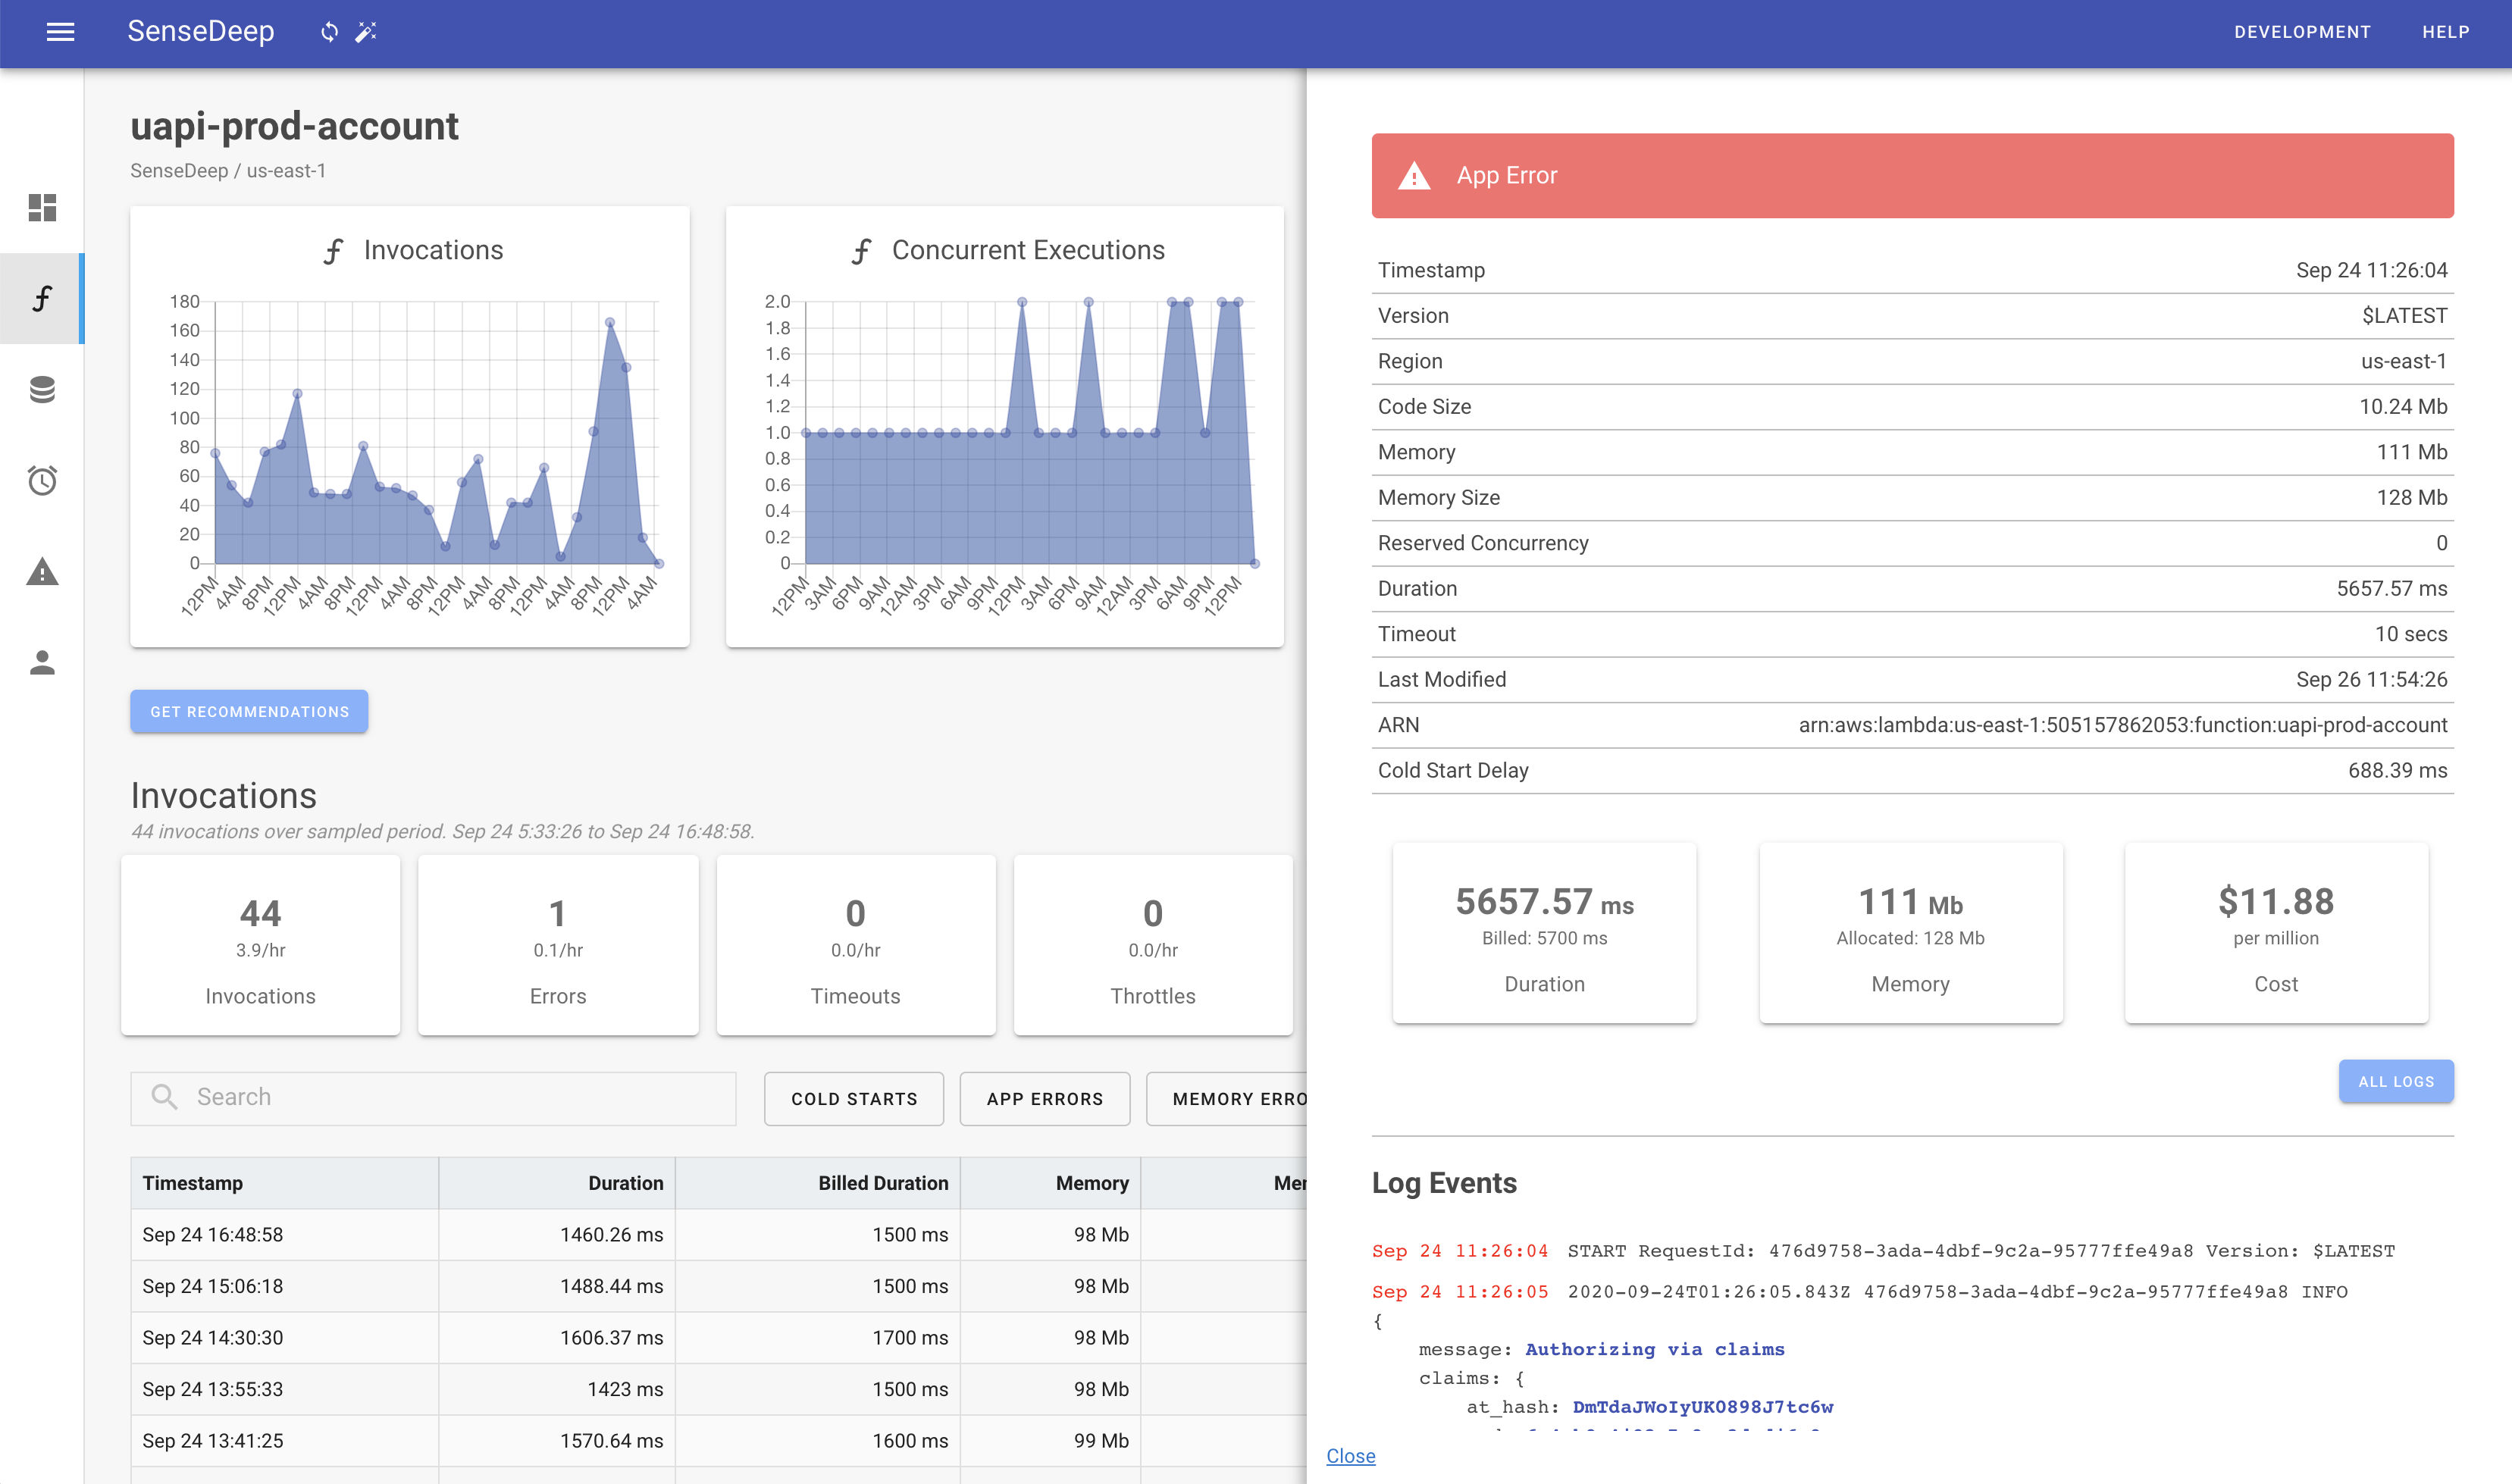
The function invocation details make it quick and easy and troubleshoot errors.
The function version, timeout, code size and ARN are presented at the top. Below that, the exact invocation logs are formatted and displayed.
The logs are color-coded and JSON fragments are expanded for clarity. You can click on the “All Logs” button to immediately jump to the full CloudWatch log at the exact location of the invocation. From there, you can see previous and subsequent events in context.
Alarms
To fully automate your error discovery, SenseDeep has a powerful Alarm and Alerting facility.
SenseDeep alarms are automated rules that check your Lambda and Log resources for specific conditions and then notify you via alert mesages.
Alarms can be created to monitor any AWS Lambda metric such as the errors, invocation rates, duration, concurrency or throttles metrics.
However, SenseDeep Alarms can also be created for ANY application log event. SenseDeep has powerful pattern matching to enable you to easily design alarms and trigger alerts for any application condition.
To use Alarms, you must create your Cloud using the IAM Role connection method rather than providing access keys. This is because the CloudFormation template creates an alarm watcher lambda function in your account to process the alarms.
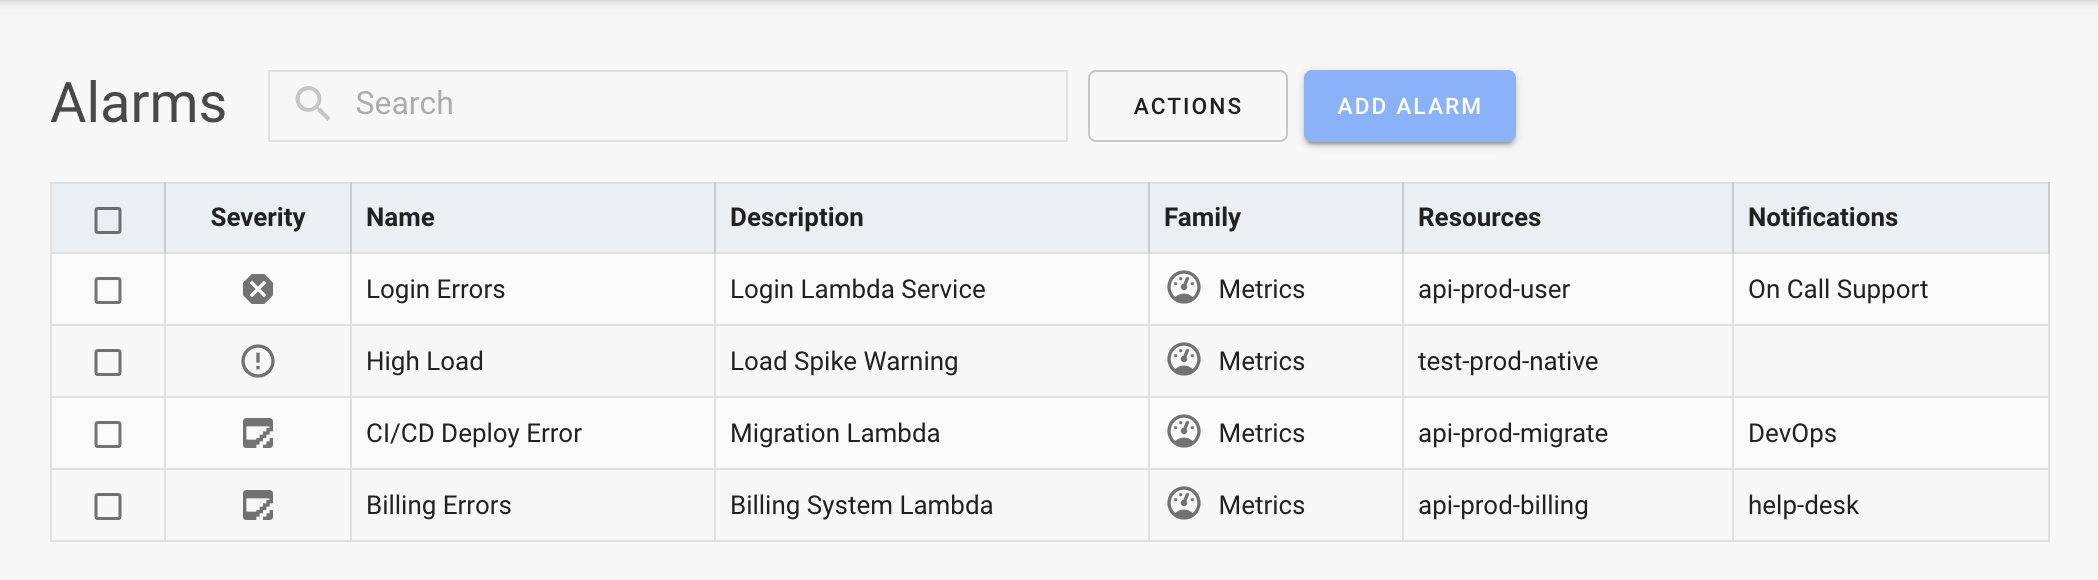
Creating An Alarm
The alarm list can be displayed by clicking on the Alarms button in the sidebar. From there, you can create an alarm by clicking on the Add button which will launch the Add Alarm slide out panel.
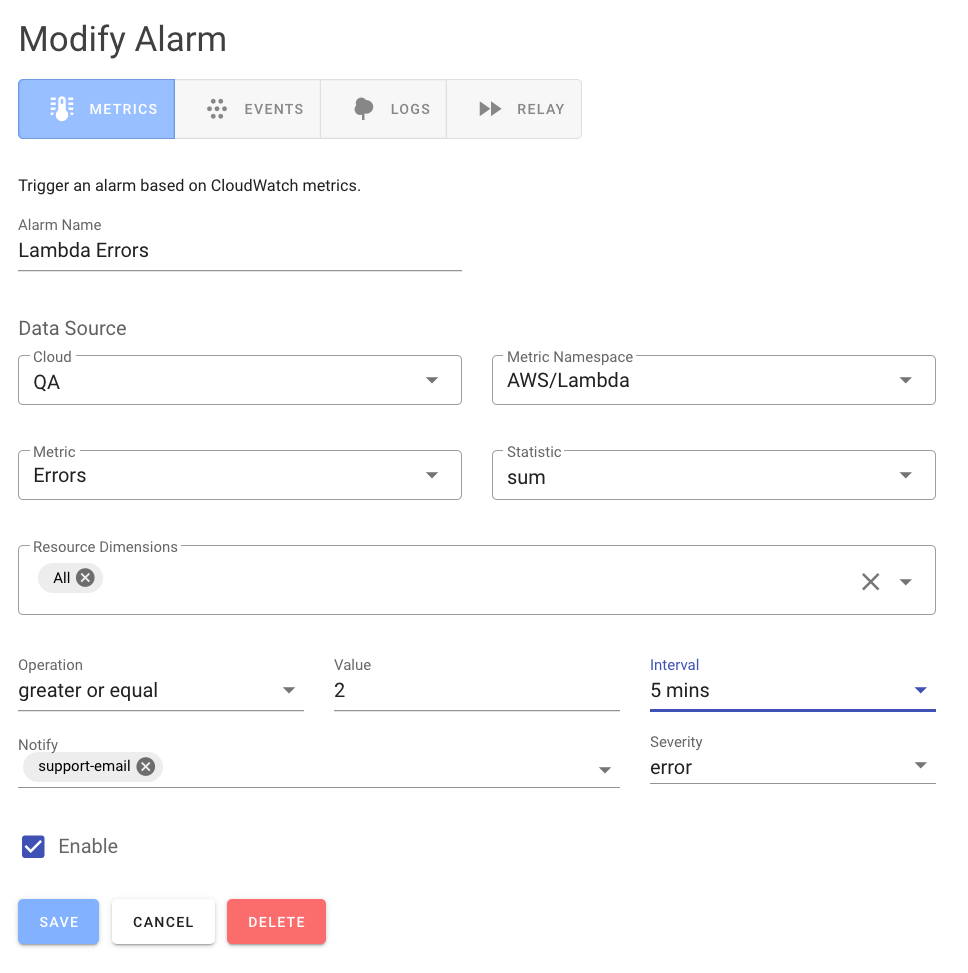
Select whether you want to monitor a Lambda metric such as errors or duration, or whether you want to monitor a CloudWatch log entry condition. Next give a descriptive name to your alarm and select the Cloud (AWS account and region) that hosts the resources to monitor.
You can select the resources to monitor by a specific resource “list”, by tags or by matching the resource name using a regular expression. The “list” option will display a multi-select dropdown from which you can select the desired resources.
To match resources by tags, enter a series of tags separated by commas. The tags should be of the form: “TagName=TagValue, TagName=Value …”. To match the resource, all the tags values must match.
To match resources by name, enter a regular expression (without the the leading and trailing “/”) to match the name.
Matching by name or by tag allows dynamic resource matching. As new Lambdas or log groups are created, the tag or name patterns will match resources as they are created or destroyed by AWS.
You can specify an excluding tag or name pattern which will be used to remove select resources from the matched set.
Notifications
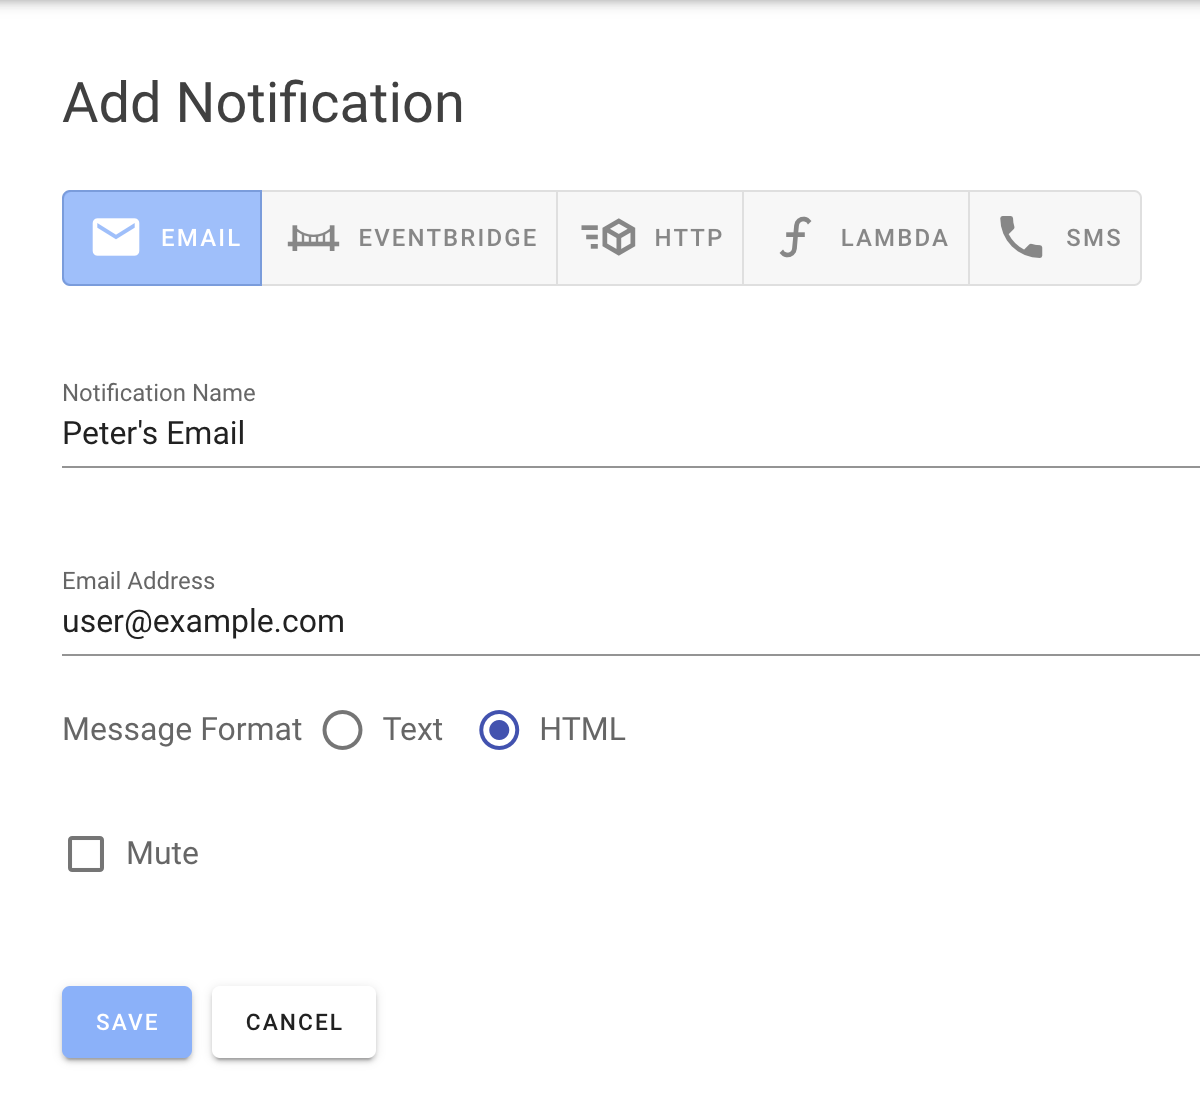
SenseDeep support a wide variety of alert notification channels including: email, AWS EventBridge, HTTP/HTTPS, Lambda and SMS messaging.
You can create multiple notification channels and individual alarms can specify a unique set of multiple notification channels.
Email Notifications
Emails notifications can be in text or HTML form.
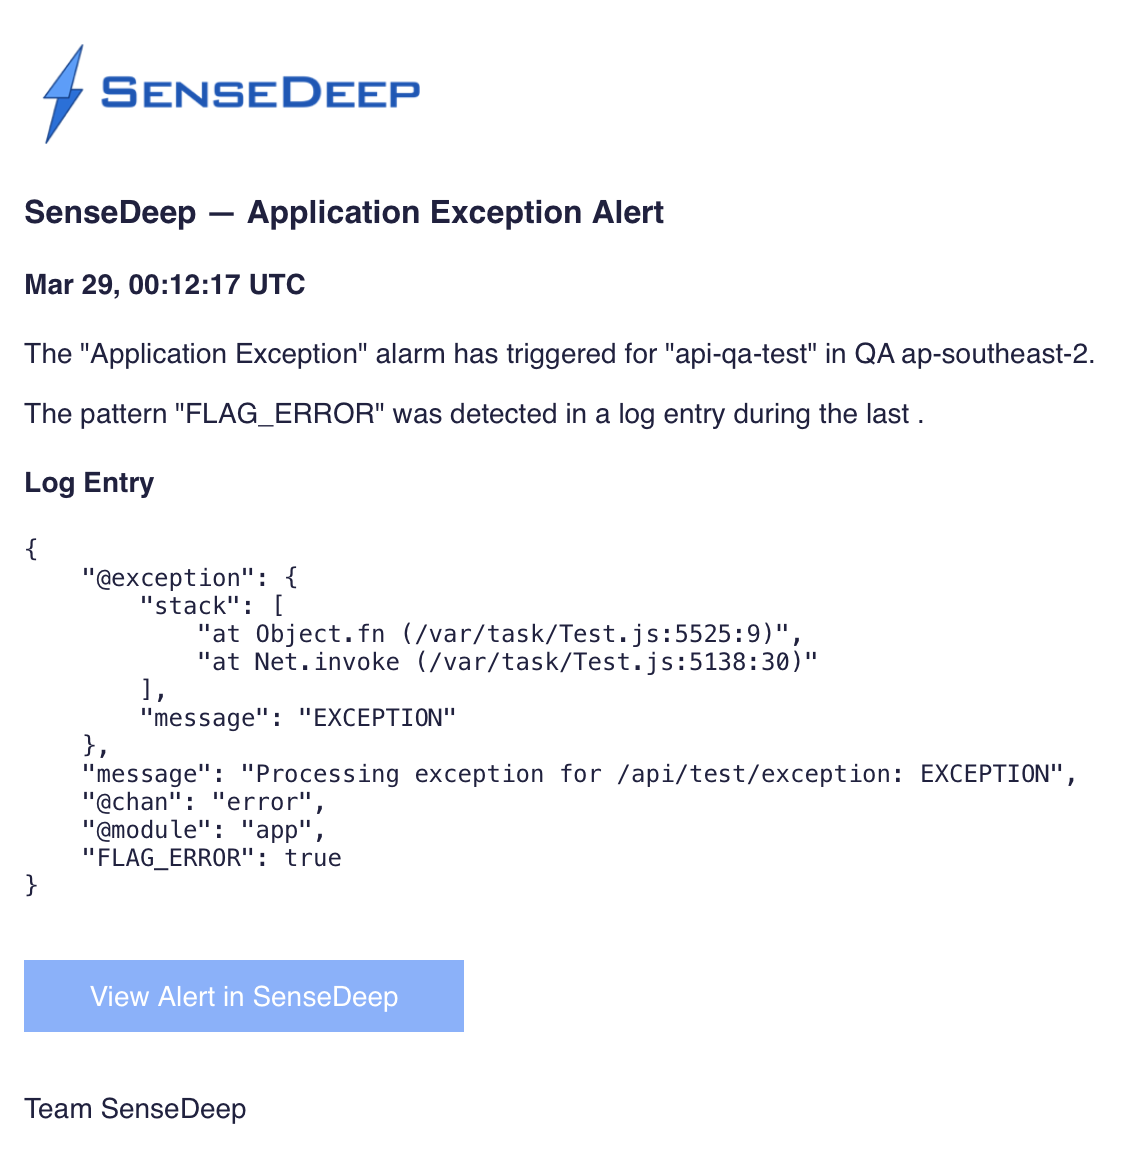
The email notification has a “View in SenseDeep” button/link to launch SenseDeep and view the alert. From the alert, you can go directly to the actual Lambda or Log invocation entry to see the exact sequence that caused the error or condition.
Alerts
Alerts are created when an alarm is triggered for a resource and are displayed in the alert list.
Similar alerts are coalesced and the repeat count is shown on the list. Alerts can also be assigned to a team member for resolution and the assignments are show on the alert list.
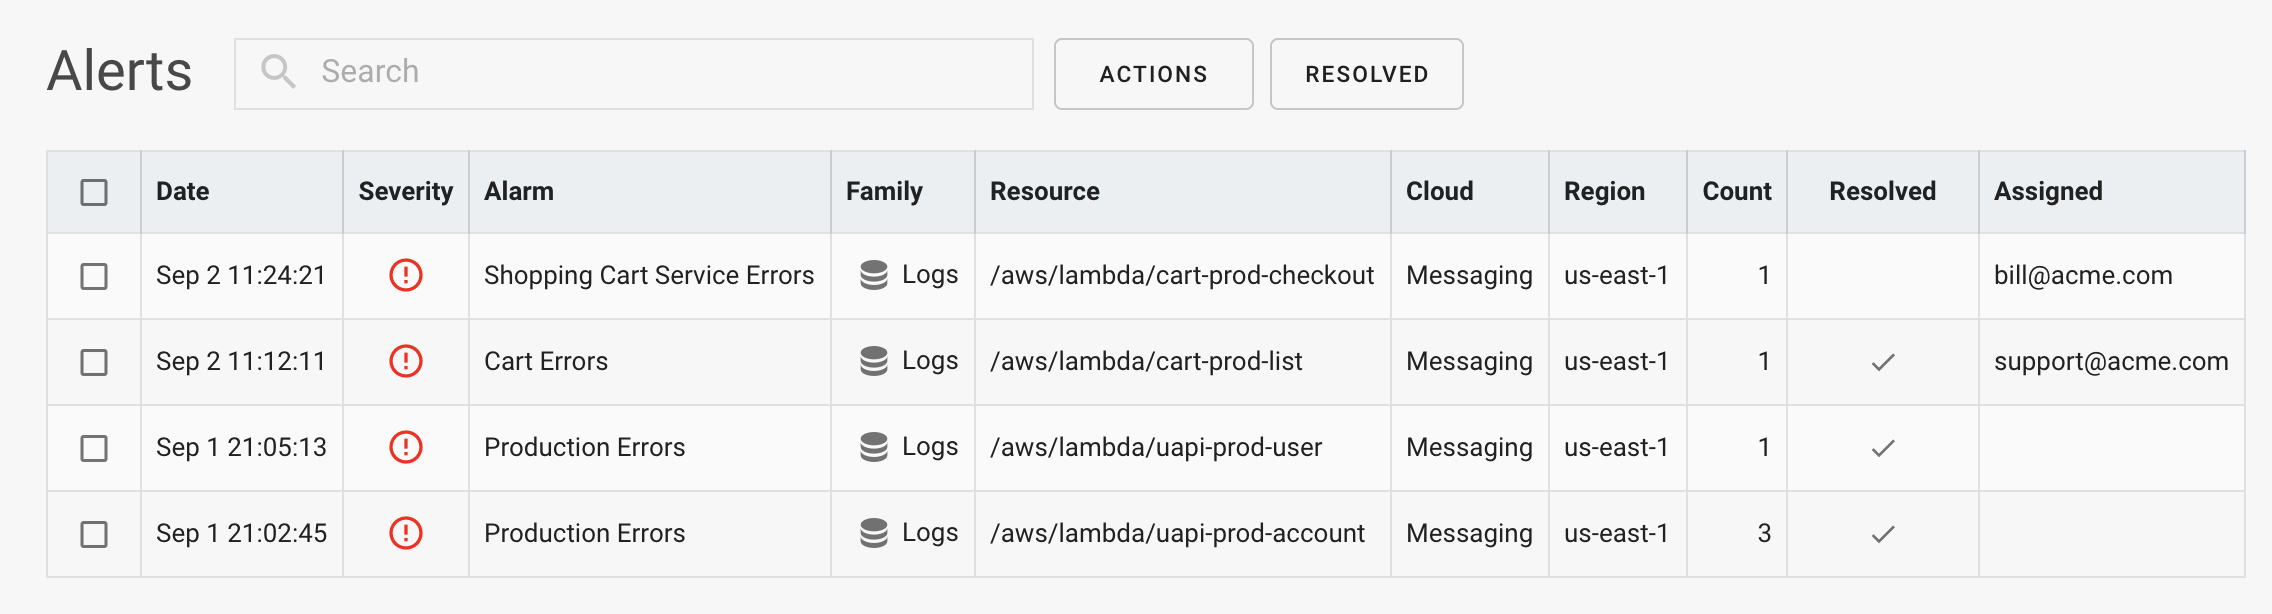
When the underlying cause of the alert has been diagnosed and rectified, the alert should be “resolved” by marking it as such on the Modify Alert page. If the alarm then triggers again, a new alert will then be created.
Log List
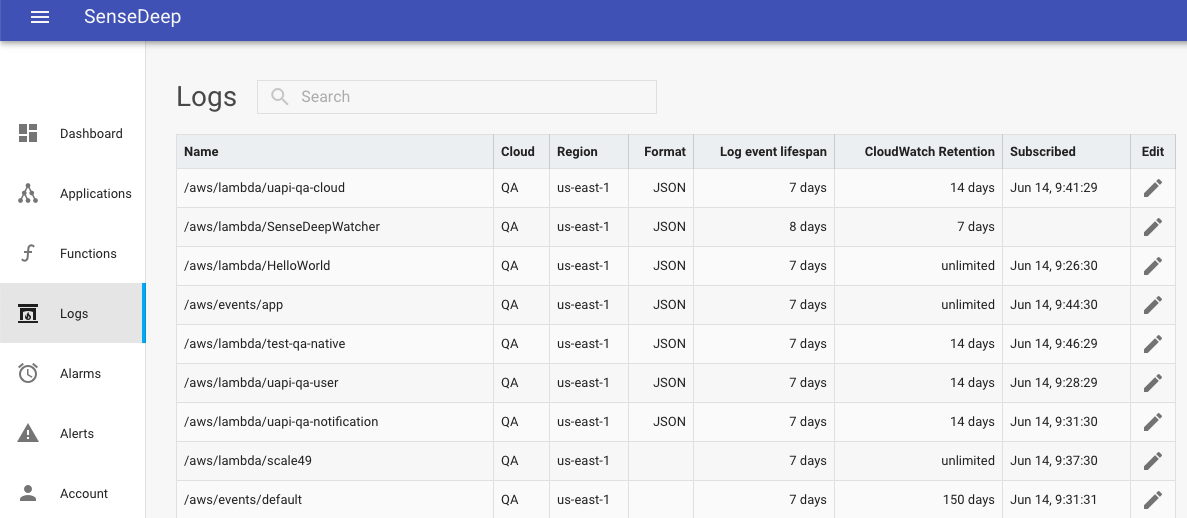
The Log list displays all your CloudWatch log groups. These will include your Lambda logs, but will also include any other CloudWatch logs in your AWS accounts.
From the list, you can enable local monitoring for a Log by toggling the Monitor slider, or by selecting multiple logs and clicking the Toggle Monitor action. When enabled, the log events will be downloaded and cached by your browser for transparent and immediate viewing.
Log Format
You can configure how the log data is cached and parsed for each AWS log group. You can set the log format for your application log messages and to update caching limits. Click the edit icon for the log you wish to modify and the modify log panel will be displayed.
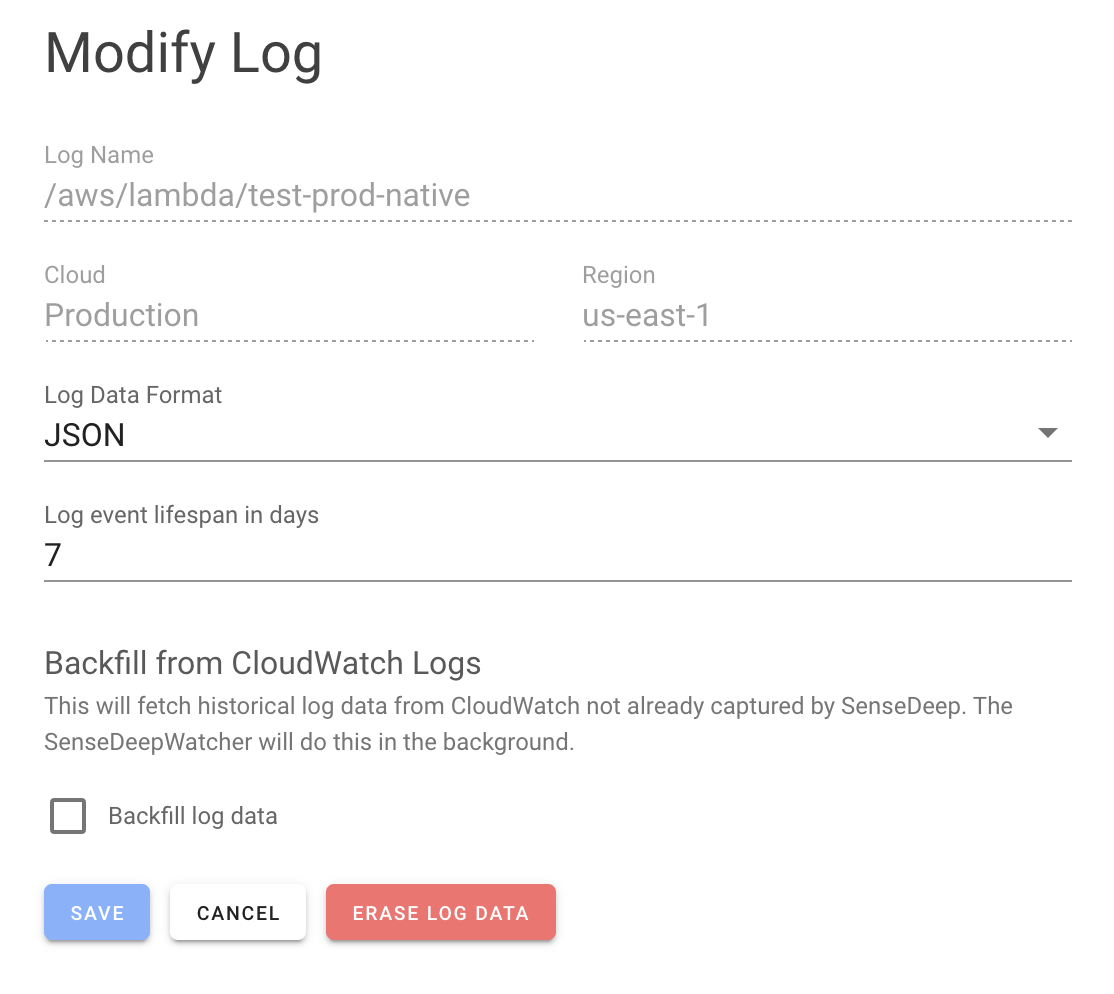
Customize the maximum amount of log data, the maximum age of events and the number of streams to download for the log group. These three parameters control the events that will be downloaded to your browser cache.
You can specify a single log stream for the view or all log streams by using * as the stream name. When selecting all streams, SenseDeep will fetch event data from streams and automatically aggregate the log event data from each stream and order by timestamp.
The Log Format specifies the formatting of your application log events. SenseDeep can autodetect some formats such as JSON and Syslog formats. If you know the format, select it from the drop down list. If you do not know, select “Plain Text”.
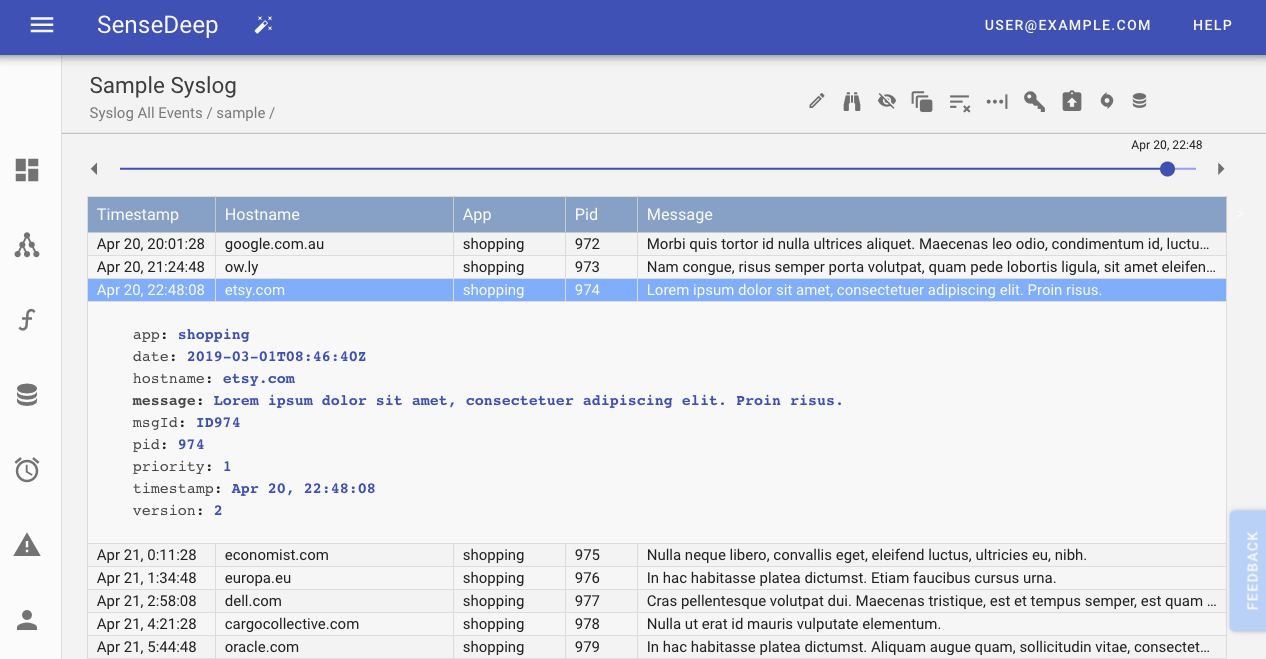
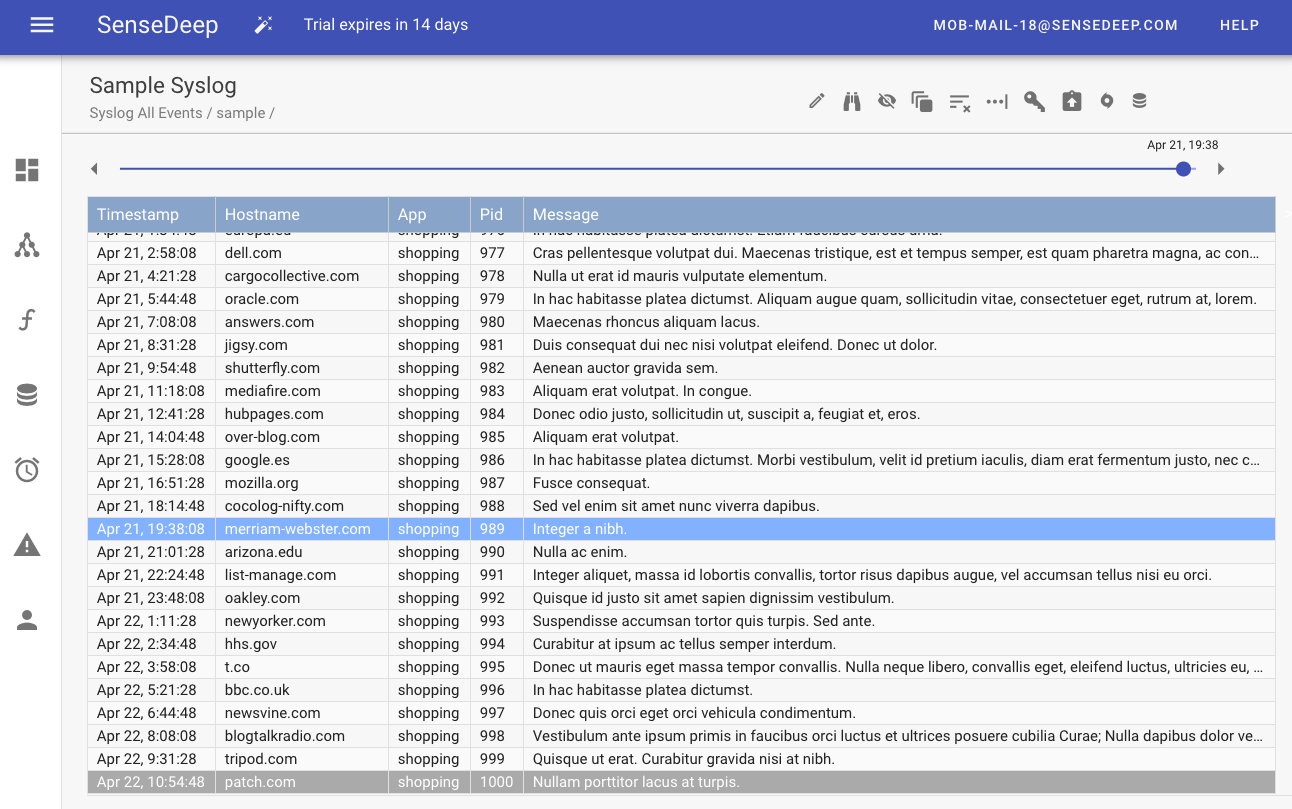
Log Viewer
SenseDeep has a blazing fast log viewer with real-time updating so you never need to click reload in CloudWatch again.
From the home page, select the log view to display by clicking on the view card. This will launch the viewer to display events for that log view. You can scroll forwards and backwards over log data and SenseDeep will transparently download log data as required. The first and last log events are highlighted with a reverse grey background and the current record is highlighted in blue.
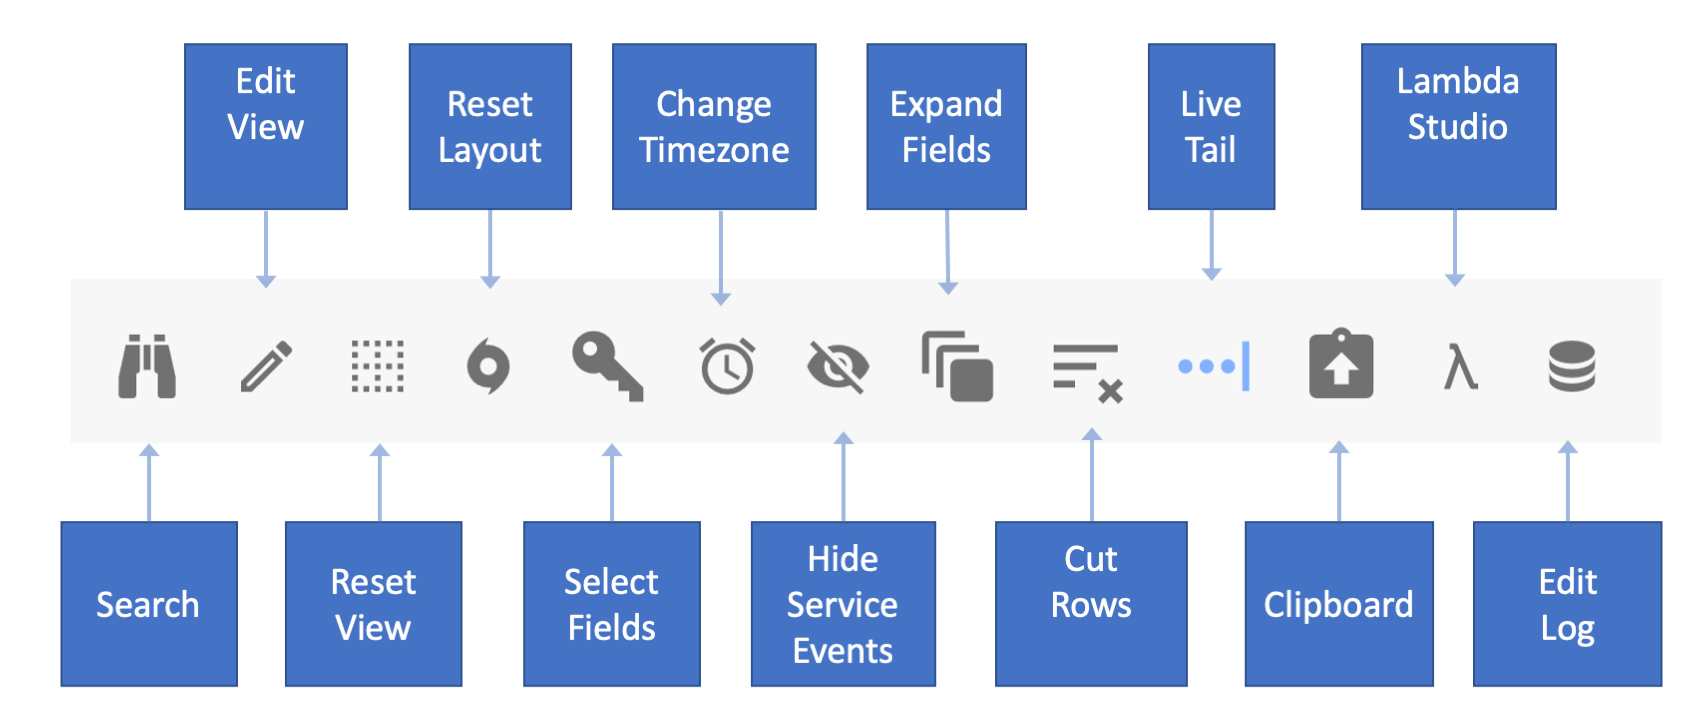
Viewer Navigation Bar
The SenseDeep Viewer navigation bar provides quick access to the most common viewer commands.
Scrubber
The timeline scrubber permits you to jump to the start or end of the log file or any arbitrary date in between. This modifies the highlighted current line in the log file. Clicking on the scrubber date box will display a date and time edit dialog.
Filter Events
The filter box accepts any text and will filter the log view to display only those records containing the filter text. Click the ‘X’ to clear the filter. The entered text is used for a plain-text search of log data. If you require more powerful field-based or regular expression searches, use the “Edit View” icon.
Hide Service Events
Some AWS services, such as Lambda, emit many service related log events. Lambda emits a log record for the start and end of every function invocation. To hide these service related events so you can focus solely on your application log data, click the “Hide Service Messages” icon.
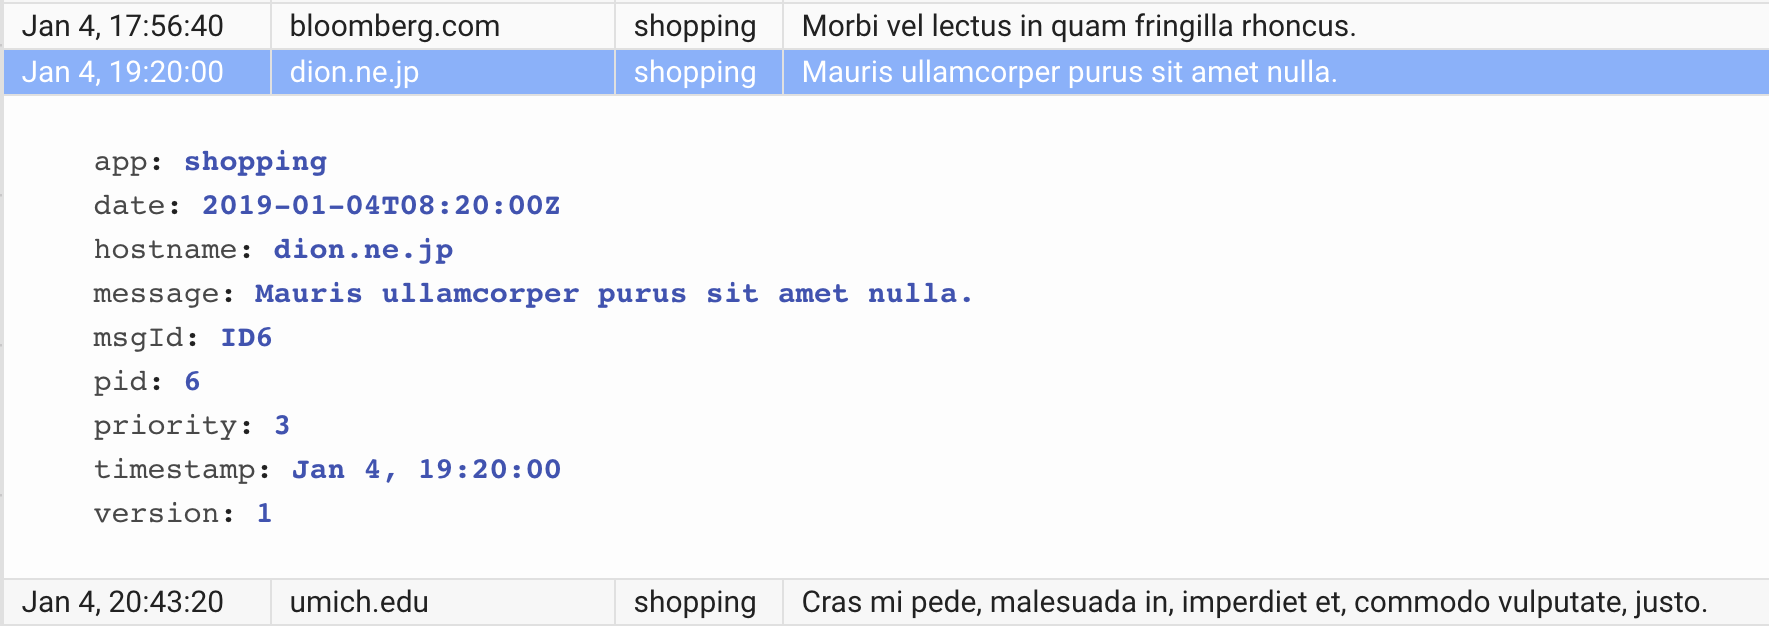
Expand Log Records
The Expand / Collapse icon will expand all log entries and display all fields vertically. Clicking the icon will collapse any expanded fields. You can also type the ENTER key or Control-Click a row to expand or collapse individual records.
Cut Down Log Events
Sometimes you may wish to only focus on new log data and not be distracted by any historical or prior log data. For example, you may be developing a Serverless Lambda application and you want to trigger a specific log condition and be able to easily locate that new log data. The SenseDeep Cut Log Data can help.
The cut log icon will discard all prior log data and display only new log data. This is useful when used in conjunction with the Live Tail option below. Clicking the cut icon a second time will restore the cut log entries.
Live Tail
The Tail icon puts the view into “Live Tail” mode where new log data is automatically fetched and appended to the end of the log view. If you have scrolled to the end of the view, the Viewer will automatically scroll as new log data is fetched.
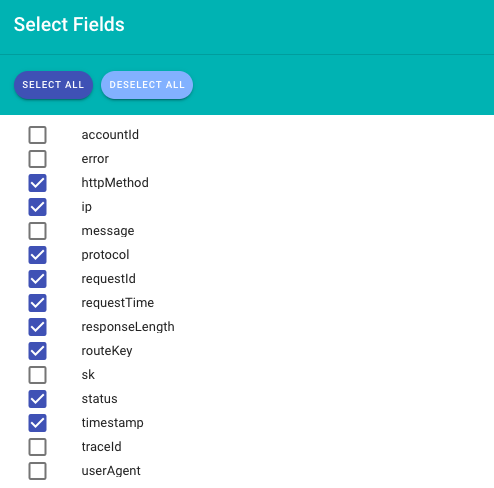
Select Fields
The select fields icon will display the select fields icon. This new release has two important enhancements. SenseDeep will automatically select a default set of top level fields when the view is first created. Thereafter, you can add or remove fields. If you select the “Freeze” checkbox, the view fields will be fixed (frozen) and not be modified as new fields are discovered in the data stream.
By default, the Viewer orders fields in sorted order. If you add a field via the select fields dialog, it will be added to the end of the table. You can drag and drop Viewer field columns to reorder the fields.
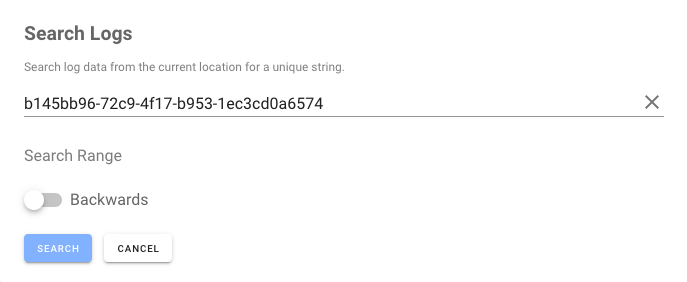
Search
The new Search dialog permits you to search within selected log records for specific text. You can search forwards, backwards or jump to the current line.
Not to be confused with the Filter text, which selects which log records to display, the search dialog selects the current record to jump to.
The search dialog can also be invoked via the Cmd-F keyboard shortcut.
Copy to Clipboard
You can copy the full log data for the current event to the clipboard via the “Clipboard” icon.
Reset Layout
To reset the viewer layout for the current log, use the “Reset” icon. This will restore the view to the default field selection and spacing.
Edit Log
If you need to specify the format of your application log messages, use the “Log” icon. From the Edit Log panel you can also configure the configured cached data limits for the log.
Context and Navigation
Log files can be confusing places. Gigabytes of log data that is often confusingly similar. Find an application error and then maintaining context as you look around at related log data can be difficult. SenseDeep helps this situation by maintaining a “current” line context and by highlighting that line in blue to make it easily visible.
You can navigate from the current line by using Arrow keys up and down, or by clicking on any line to make that the current line. Use Cmd-J to jump back to the current line. The Search dialog (Cmd-F) can be used to search for a specific text pattern and jump the current line to the first such occurrence of the pattern.
SenseDeep preserves your context as you expand log entries, select new fields or resize or reorder columns.
Double Click
You can quickly filter events based on text in a log record by double clicking on the text. That will copy the field text to the Viewer filter text box.
Clipboard
To copy the current record to the clipboard for export to another application, use the Cmd-E key to export the current record to the clipboard.
Short Cuts
In summary, here are the keyboard shortcuts supported by the SenseDeep viewer:
- Cmd-E — Export the current record to the clipboard
- Cmd-F — Find text in the log view
- Cmd-J — Jump to the current records
- Cmd-X — Cut
- Cmd-Click &mdash ; Expand record
- Up / Down arrow keys — Move the current row up or down
- Enter — expand the current row
On Windows, use Control instead of Cmd.
Resize and Rearrange Log columns
You can rearrange event columns by dragging and dropping to the desired position. You can delete columns by dragging away from the table heading.
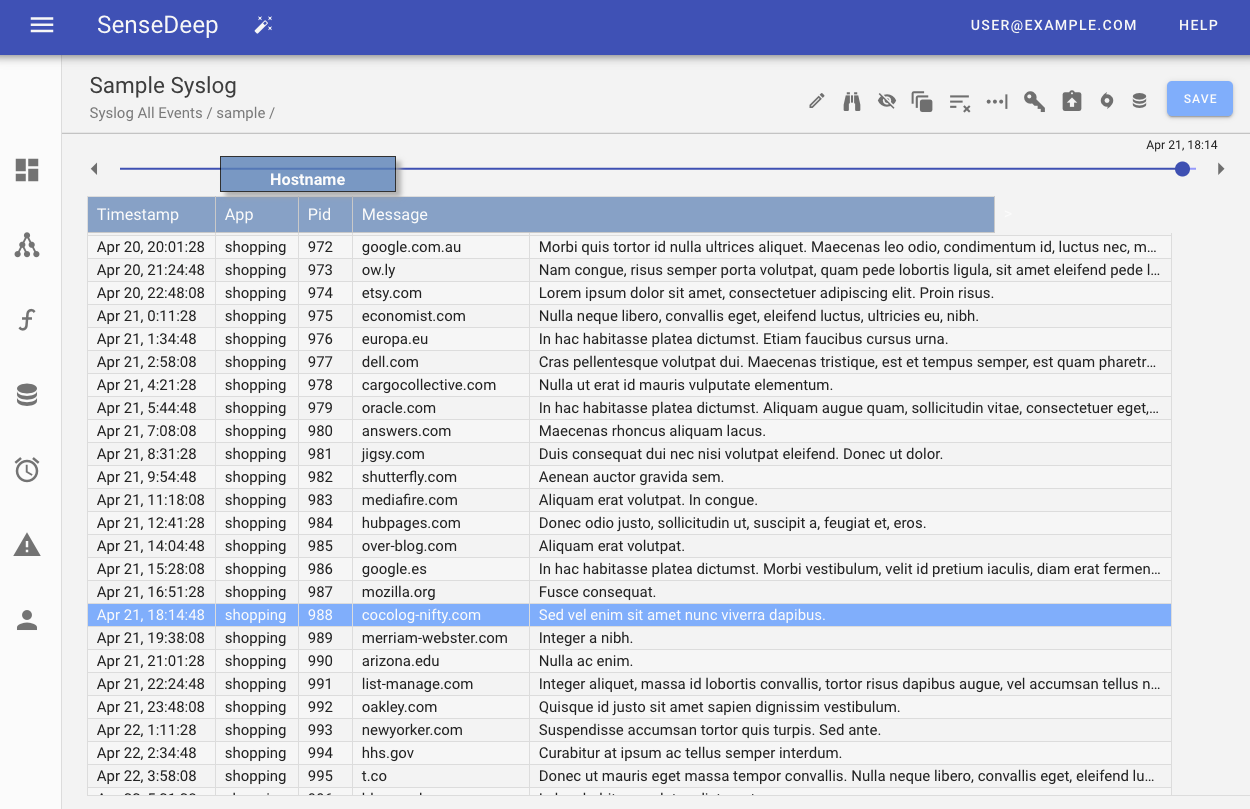
Column widths can be resized by dragging the column separator in the title (only) to the desired width. Your changes will be saved uniquely for each view.
Advanced View Options
From the viewer, you can edit the advanced view options by clicking on the Edit View icon.
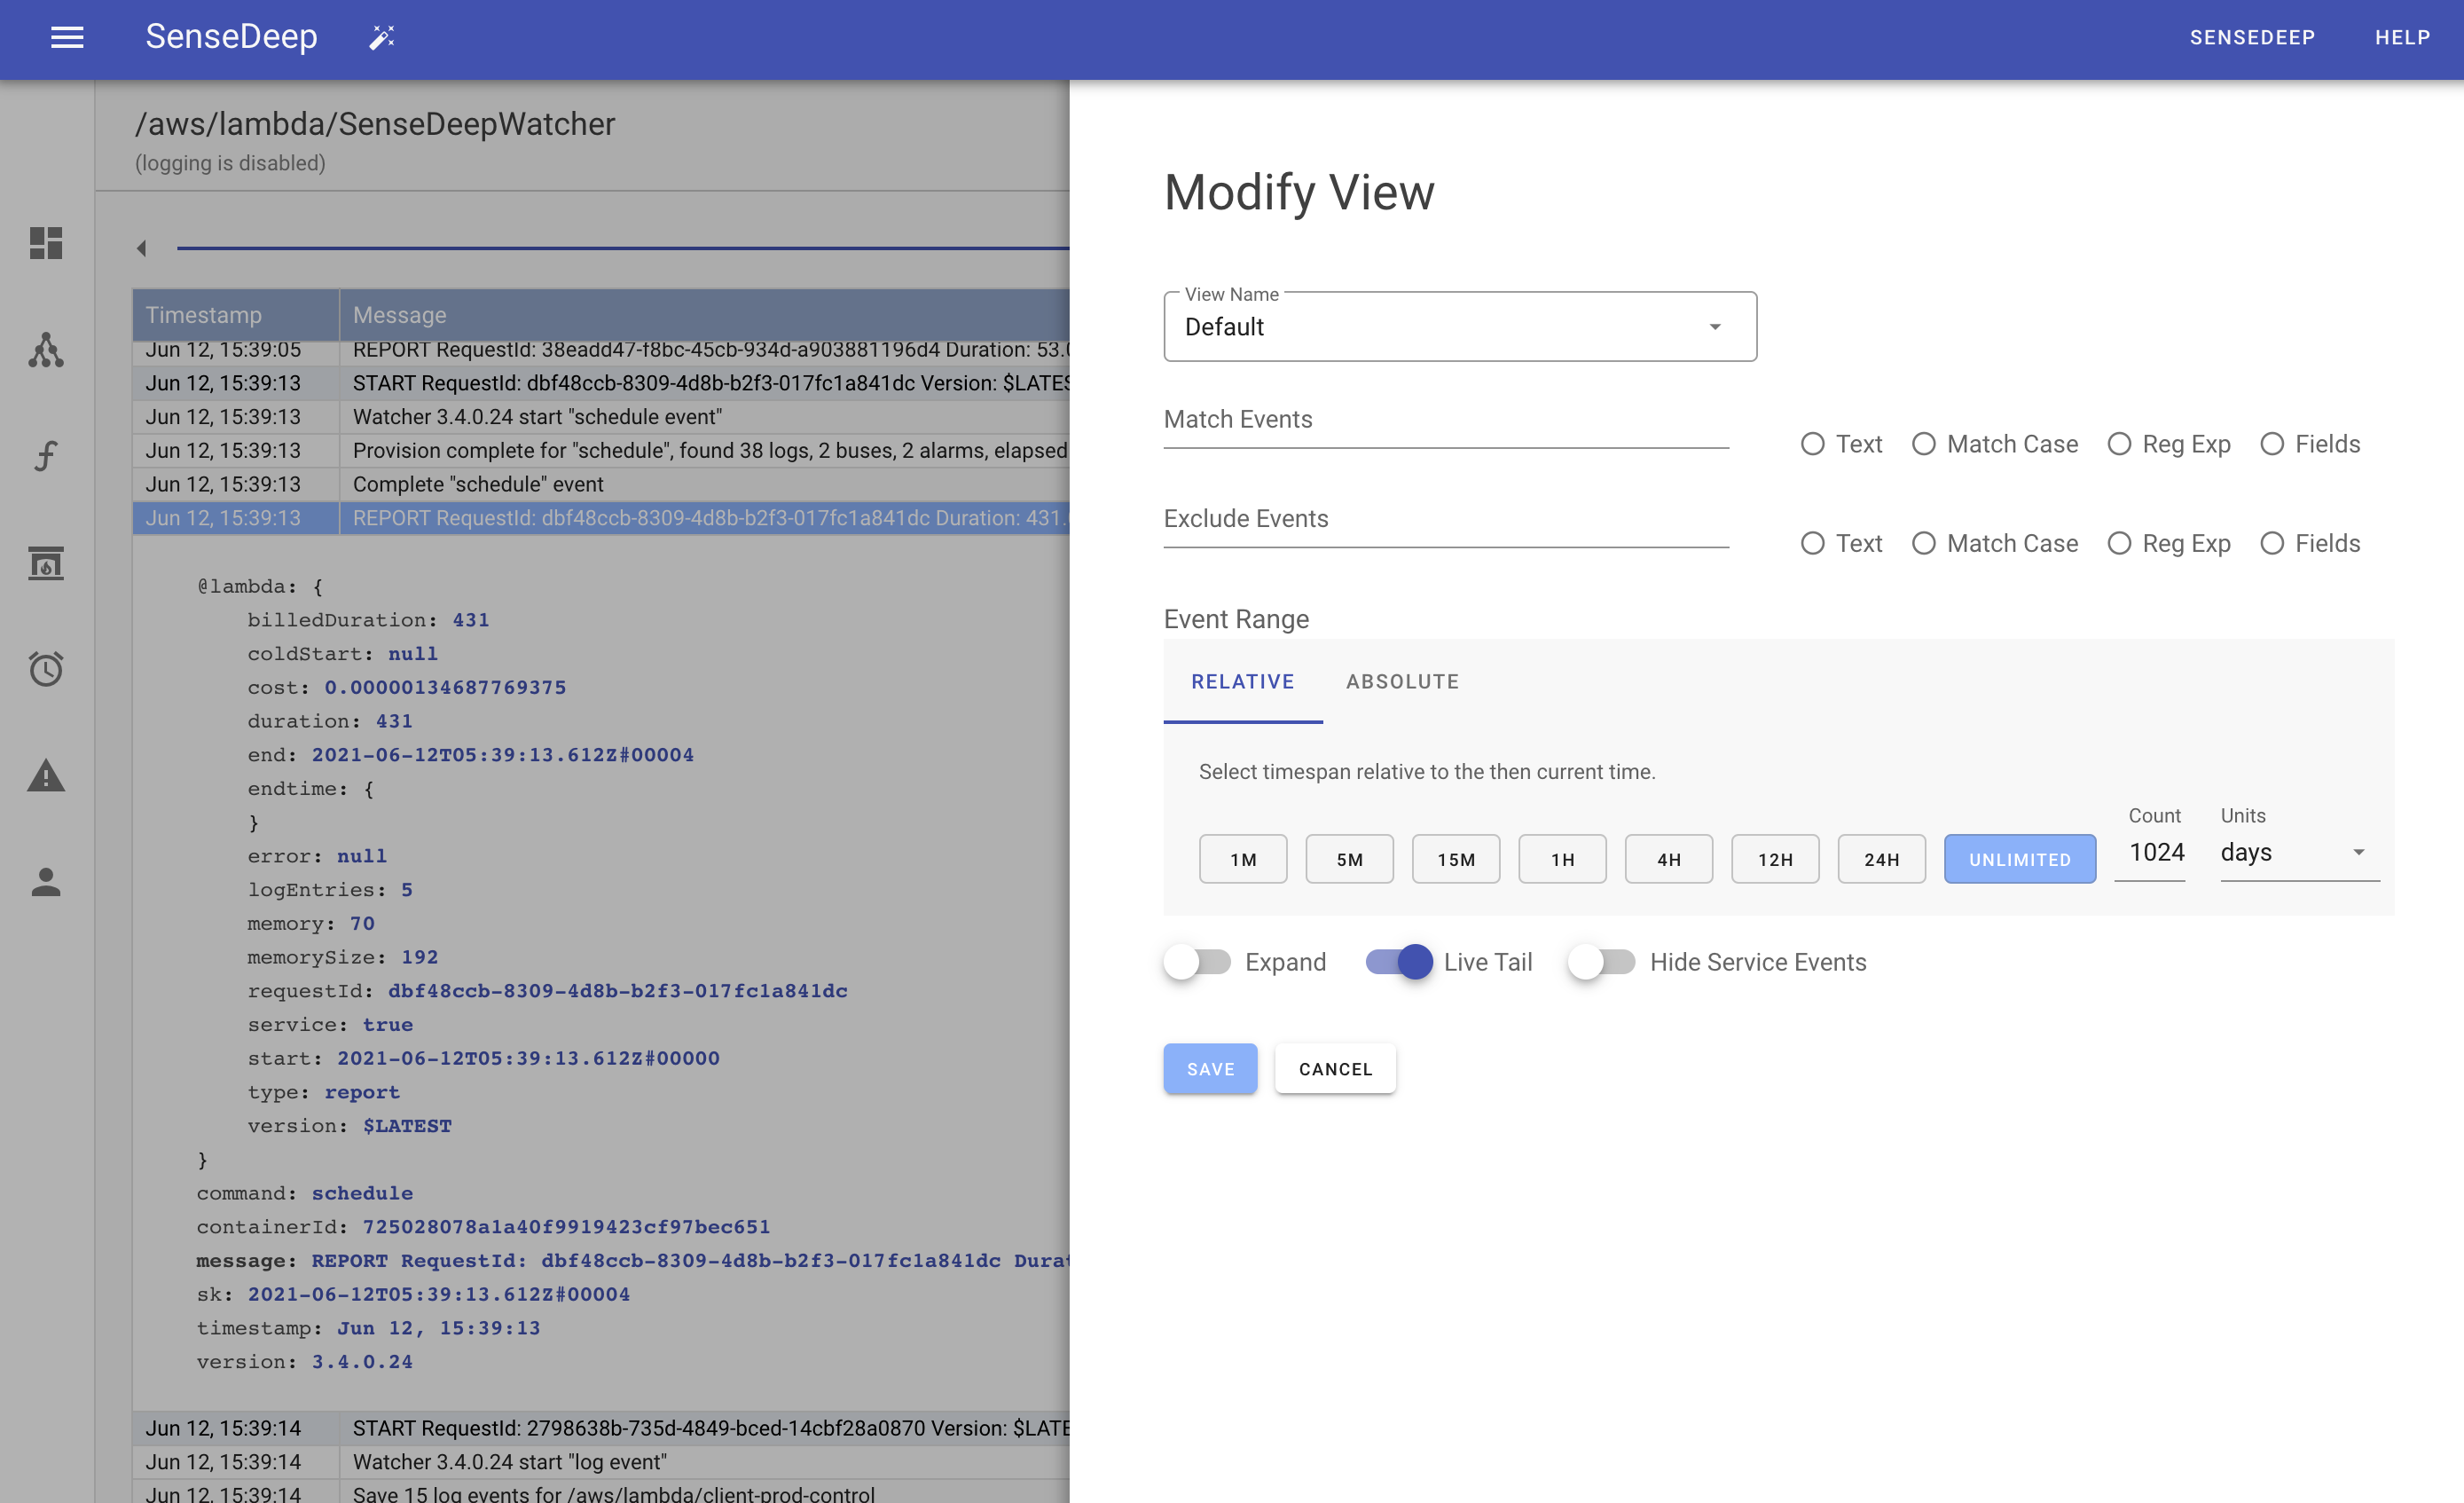
When editing a view, you can create a new view via the “Save As” button. This will create a new view card on the dashboard with the range and filter options you specify.
Filtering
You can filter a subset of events by specifying a filter critera to “Match” events, “Exclude” events or a combination of both.
Filter by Text
Events can be filtered by specifying a matching text pattern. SenseDeep performs full-text matching against all fields of the log event record. Text matches are performed with case-less comparisons.
Filter With Case
You can also perform case-sensitive event filtering by selecting “With Case”.
Filter With Regular Expressions
Regular expressions (RE) allow powerful conditional event filtering. Enter your RE without leading or trailing slashes.
Filter With Structured Fields
If your event has structured data, you can use the SenseDeep query language to perform powerful conditional queries. The query language is based on familiar Javascript expressions with some additional operators. For example: the query:
error == "critical" && account == "Acme Corp"
will select those events which have the “Error” column set to “critical” and the “Account” column set to “Acme Corp”.
The query language supports the operators: + - * / ( ) ^ ! % == != < <= > >= ^= ^!= $= $!= << >> && || <> ><
These extension operators have the following meaning a ^= b a starts with the string b a ^!= b a does not start with the string b a $= b a ends with the string b a $!= b a does not end with the string b a >< b a contains the string b a <> b a does not contain the string b
Sub-expressions can be grouped with parenthesis and the boolean operators && and || can group conditional operands.
Regular expressions (delimited by slashes) may be used with the “==” and “!=” operators. The regular expression can be on either side of the operator.
The SenseDeep query language understands the types: Numbers, Boolean, String literals, Regular Expressions and NUL.
Event Range
You can select a subset of log events to display via the event range slider. Drag the start and end markers to the desired times. If you click on the start or end mark labels, you can enter explicit dates and times.
Only the event within the selected range will be displayed.
Raw Expanded Display
If your events contain multi-line data, you can click on each event to expand the event inline to make the event easier to read. Selecting “Raw Display” the panel will expand all events inline.
Log Formats
The Log Format specifies the formatting for events in your log group. SenseDeep can autodetect some formats such as JSON and Syslog formats. If you know the format, select it from the drop down list. If you do not know, select “Plain Text”.
Some formats allow event fields to be extracted and displayed as columns in log views.
Anchor Pattern
An anchor pattern is a simple way to specify a log format where fixed patterns are used between log fields. For example:
GET * HTTP/*
The variable portions of the pattern are specified via “*” wildcards. These then correspond to the Field Names which are specified as a comma delimited list.
JSON
JSON is the preferred log format as it permits highly structured data. Nested JSON is permitted. The log view column names are mapped onto the JSON top level property names.
Key Value Pairs
Key value pair formats support the following forms:
key=value key=value key=value...
Values may be enclosed in quotes. The key names are used as the log view column names.
Plain Text
The plain text format is used when the event data is irregular or unstructured. It should only be used when a format that extracts meaning from the event fields cannot be employed.
Regular Expression
A regular expression may be used to specify the format by using grouped sub-expressions that map onto field names. The field names are used as the log view column names.
Syslog
The current Syslog format RFC5424 is supported as well as the legacy RFC3164 format.
Organizations and Sharing
SenseDeep groups clouds, logs and views into an organization. By default, each user is given a “personal” organization for their logs. However, you can create new organization with clouds, logs and views, to which you can invite other members via email requests to join your account and organization.
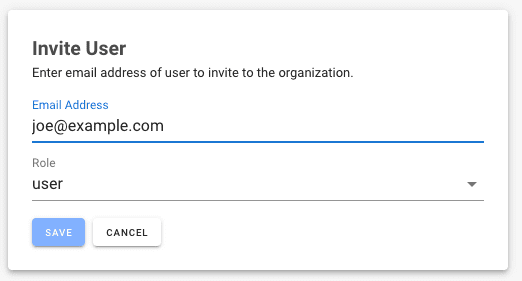
When you invite members, you can specify their role in the organization as either “admin” or “user”. Users with the role of “user” are limited in the operations they can perform and can view log data without the ability to modify cloud, view or log configuration.
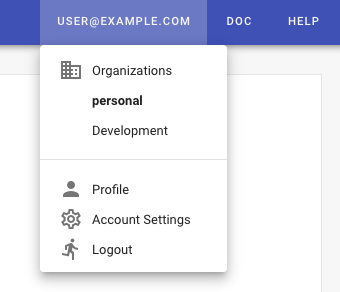
When other members accept your invite request, they automatically see the new organization with all its log views. Users can then easily switch between the invited organization and their personal organization from the top navigation bar.
Subscribing
SenseDeep offers as 14 day evaluation trial for the SenseDeep Team plan. After that, you can subscribe to a plan of your choice. Options are available for monthly or annual subscription. To subscribe, select your SenseDeep Plan and then enter your card details.
Thanks
Thanks for trying SenseDeep. Please let us know if you have comments or questions by emailing us at dev@sensedeep.com.