SenseDeep DynamoDB Metrics
SenseDeep DynamoDB metrics is a suite of in-depth performance metrics for DynamoDB. It includes metrics at the account, table and application entity levels.
Developers are adopting DynamoDB single-table design patterns as the preferred design model where all application data is packed into a single-table. However the standard DynamoDB metrics are not able to gain insight into these new levels and cannot offer per-entity metrics.
SenseDeep metrics instrument your application to expose performance metrics at a granular level, down to each application entity or API invocation.
Table Standard Metrics
SenseDeep provides standard AWS DynamoDB metrics, enhanced single-table metrics and account level metrics.
The DynamoDB standard metrics display overview metrics and operation details for a whole DynamoDB table. These metrics come from the standard AWS CloudWatch DynamoDB metrics.
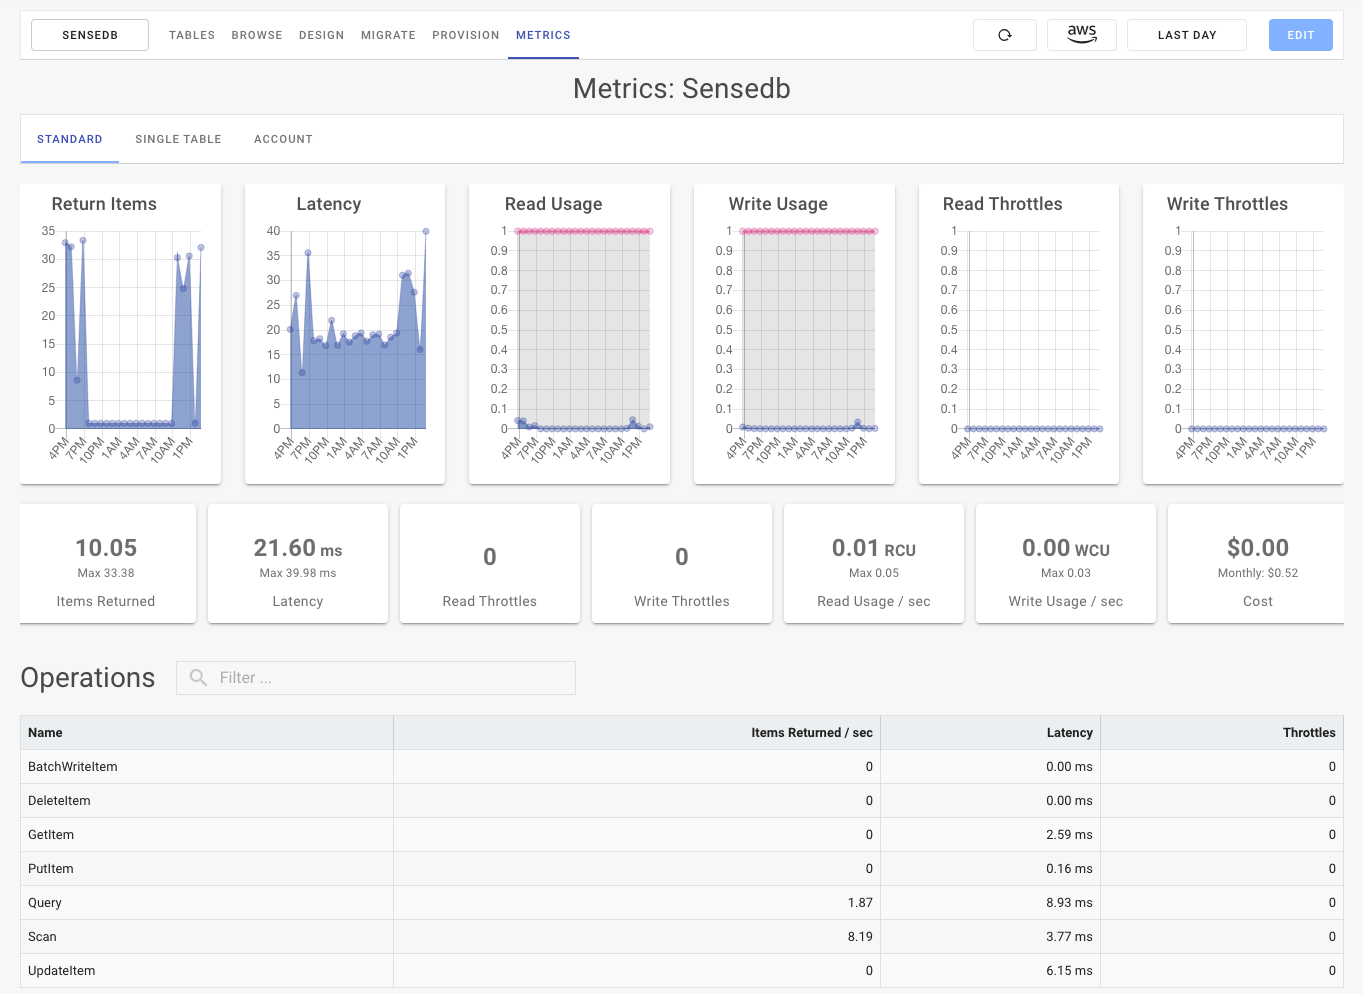
In a single page, all the important standard metrics are aggregated and presented. These include:
- Returned Items — The average number of items returned over the period.
- Latency — The average latency for requests over the period.
- Read Usage — The Read Capacity Units (RCU) consumed over the period.
- Write Usage — The Write Capacity Units (WCU) consumed over the period.
- Read Throttles — The number of read requests that were throttled over the period.
- Write Throttles — The number of write requests that were throttled over the period.
Below the graphs are metric cards that include the average and maximum values. Also displayed is the DynamoDB cost of service over the period. This includes the raw DynamoDB I/O charge and does not include transfer, storage charges or consider reserved pricing discounts.
Below the info cards is the Operations table which includes per-operation metrics.
If you need access to a specific metric that is not provided by the dashboard. You can easily create a custom widget and dashboard for that metric from the SenseDeep dashboard.
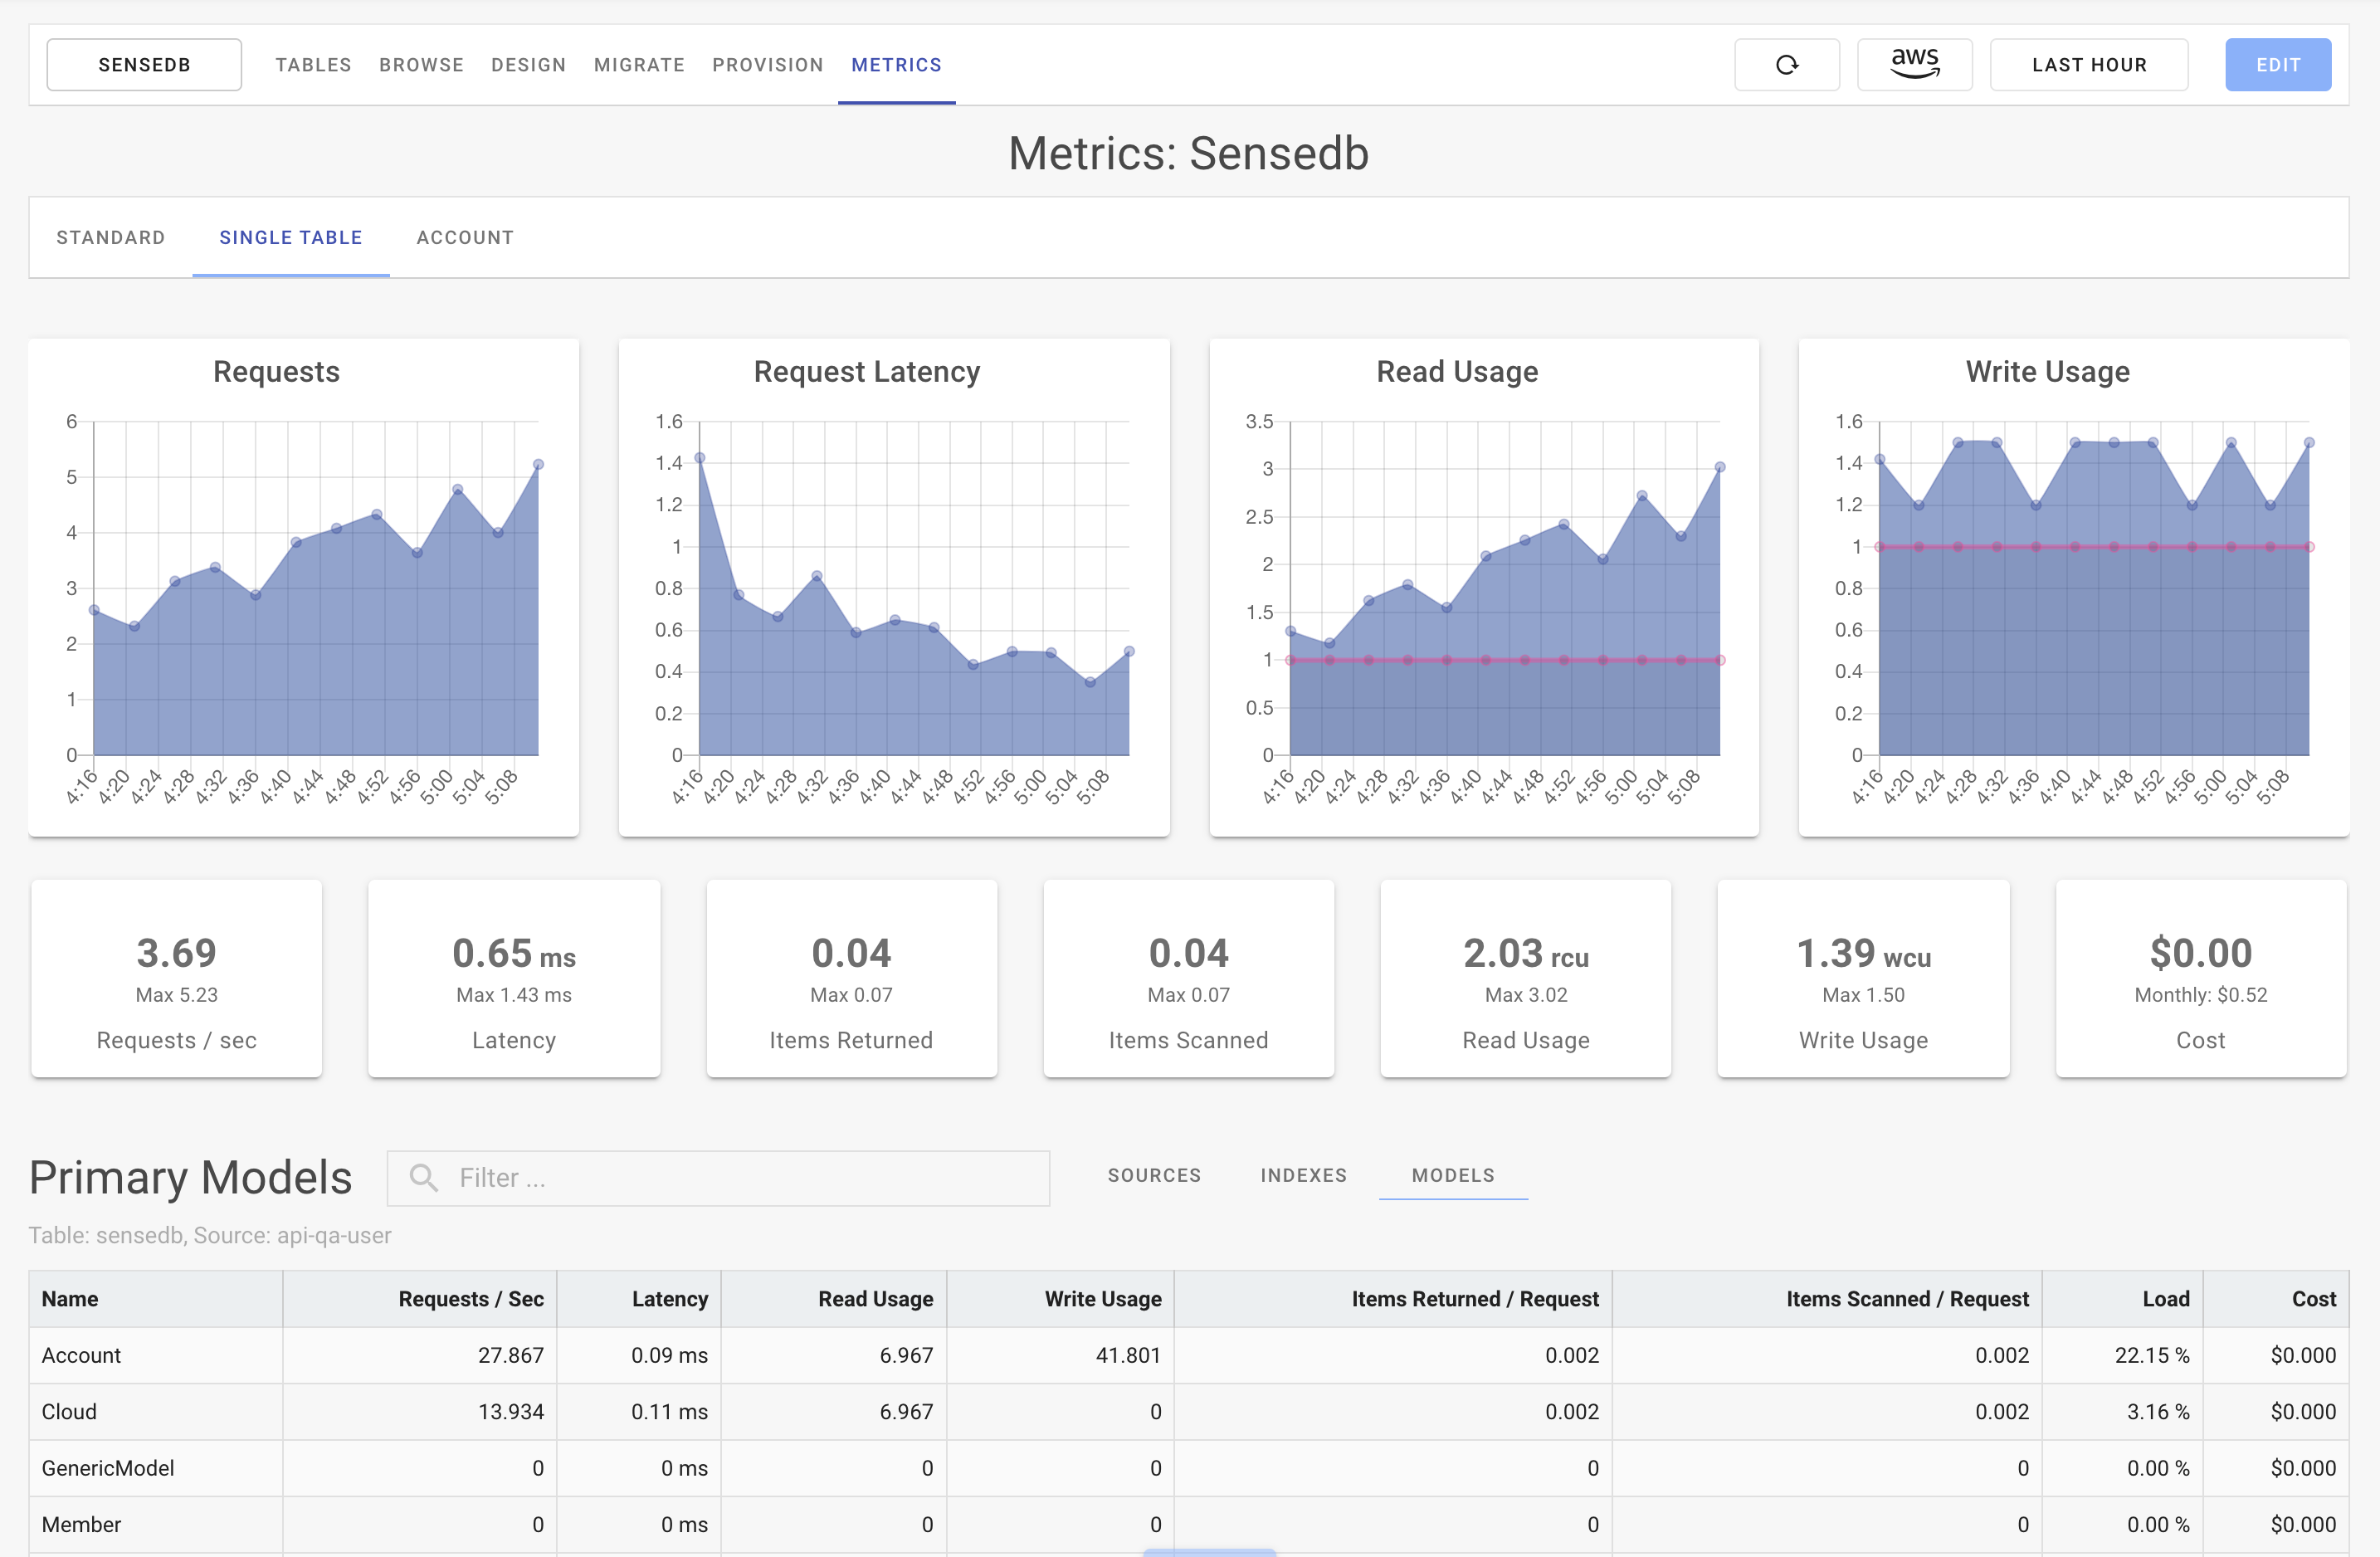
Table Single Table Metrics
DynamoDB Single-table designs are more complex and require per entity/model performance monitoring and metrics. Traditional monitoring covers table level and operation level metrics only. What is missing is the ability to see single-table entities and their performance and load on the database.
If you’ve wondered:
- Which customer tenant is causing the most load and consuming the most RCU/WCU?
- Which app or function is causing the most load and consuming the most RCU/WCU?
- Which single-table entity/model is most loaded and consuming RCU/WCU?
- Which operations are being used the most?
- Which queries are the most inefficient (items vs scanned)?
- Who is doing inefficient scans operations?
SenseDeep single-table metrics can answer these and other questions.
Connecting Single Table Metrics
SenseDeep supports single-table metrics for apps using the DynamoDB OneTable library or for any JavaScript app that utilizes DynamoDB Metrics. These libraries generate a configurable set of enhanced CloudWatch metrics that track DynamoDB performance.
For users of OneTable, the metrics can be enabled by setting dbmetrics to true in the Table constructor. For any other JavaScript application, install the DynamoDB Metrics package and follow the package’s installation instructions.
Both OneTable and DynamoDB Metrics are configurable at run-time which means you can tailor the tracked application dimensions and enable or disable metrics as you wish. With both packages, there is negligible computational overhead. Both incur CloudWatch metric charges depending on the number of dimensions tracked. See the package README’s for details.
Tracked Dimensions
SenseDeep tracks a set of performance metrics across a configurable set of dimensions. The supported dimensions are: Table, Tenant, Source, Index, Model and Operation.
The Tenant dimension is used for multi-tenant applications to track usage by tenant. The Source dimension tracks performance by code module, function or source. The Index dimension corresponds to the primary or global secondary index used for queries. The Model dimension is the single-table entity name and the Operation is the DynamoDB API operation.
You can customize which dimensions you wish to track via the “Edit” button for the table and select the Monitoring tab.
For each dimension combination, the following metrics are tracked:
- read — Read capacity units consumed
- write — Write capacity units consumed
- latency — Aggregated request latency in milliseconds
- count — Count of items returned
- scanned — Number of items scanned
- requests — Number of API requests issued
Drill Down
On the Single-Table page, you can drill-down by clicking on any row in the table at the bottom of the page. Initially, the table displays the source (code/function) of the metrics. This enables you to see the load caused individually by your applications and functions.
By clicking on a row, you can display metrics for the table primary and secondary indexes. Click again to display the schema entities and so on. As you drill-down, the graphs and metrics at the top of the page will display information for your selected choice.
Go back up the chain by clicking on the cookies to the right of the table filter box.
Query Profiling
You can also generate metrics for specially profiled DynamoDB APIs (queries and scans). For both OneTable and DynamoDB metrics, you can emit per-API metrics to profile a specific operation in your app.
Once you have added the profile parameter your code, you need to add the profiled dimension to the dimensions list via the “Edit” button for the table and select the Monitoring tab.
Table Account Metrics
SenseDeep also tracks a account level limits and metrics. These include the total provisioned read and write utilization and the account level read and write maximums.
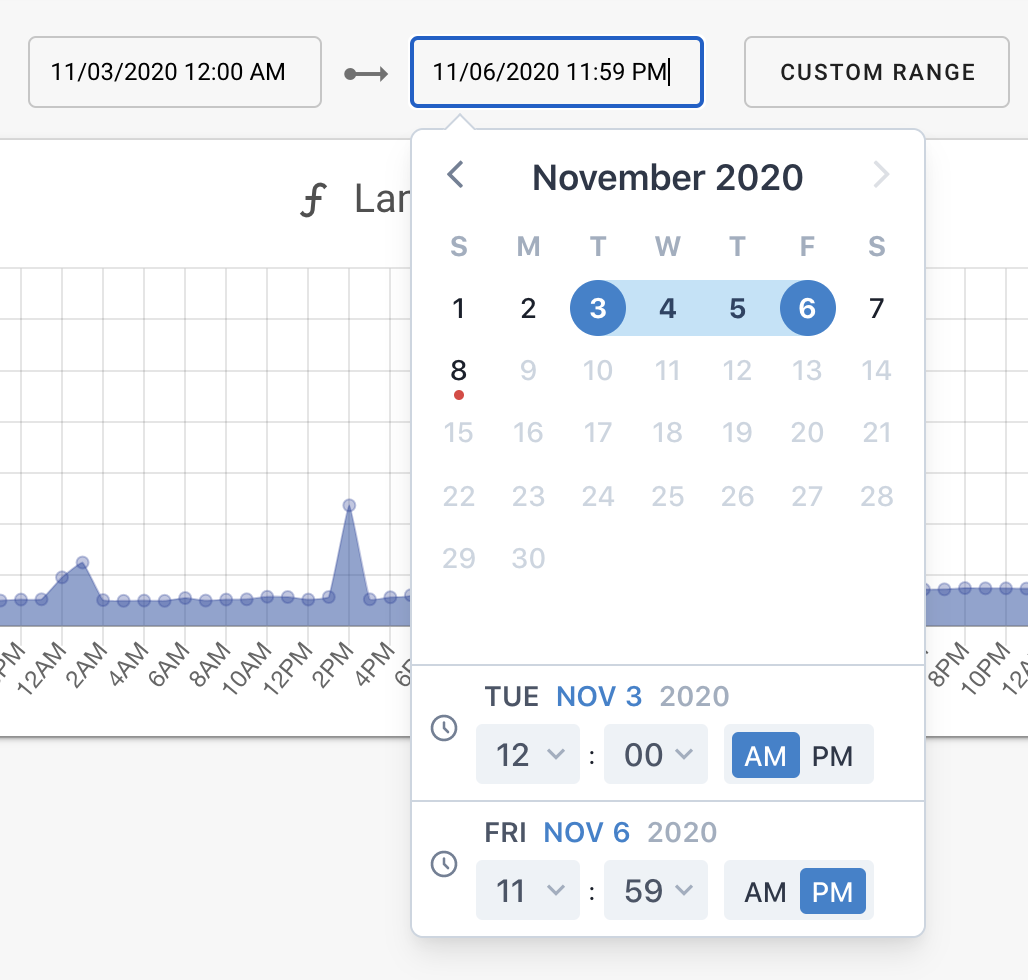
Selecting Time Periods
For any metric page, you can select the desired time range for your metrics. You can select last hour, day, week or month or any custom period.
Summary
Gaining insight into single-table design patterns is the new frontier for DynamoDB and the SenseDeep DynamoDB Studio is the start of a new wave of tools to elevate and transform DynamoDB development.
Previously, single-table design with DynamoDB was a black box and it was difficult to peer inside and see how the components of your apps are operating and interacting. Now, SenseDeep can understand your data schema and can transform raw DynamoDB data to highlight your application entities and relationships and transform your effectiveness with DynamoDB.
SenseDeep includes a table manager, data item browser, single-table designer, provisioning planner, database migration manager and in-depth table metrics — all of which are single-table aware.
More?
Try the SenseDeep DynamoDB studio with a free developer license at SenseDeep App.
You may also like to read:
- SenseDeep DynamoDB Data Browser
- SenseDeep Single Table Designer
- SenseDeep Migration Manager
- SenseDeep Provisioning Planner
- SenseDeep DynamoDB Studio
- DynamoDB OneTable
- DynamoDB Single Table Design
Try SenseDeep
Start your free 14 day trial of the SenseDeep Developer Studio.

Messages are moderated.
Your message will be posted shortly.
Your message could not be processed at this time.
Error: {{error}}
Please retry later.
{{comment.name || 'Anon'}} said ...
{{comment.message}}