CloudWatch Dashboards
Amazon CloudWatch Dashboards is a feature of AWS CloudWatch that offers basic monitoring home pages for your AWS accounts. It provides resource status and performance views via graphs and gauges.
Dashboards can monitor resources in multiple AWS regions to present a cohesive account-wide view of your accounts.
CloudWatch Dashboards is an entry level offering and if you require more sophisticated dashboards, you should consider a 3rd party monitoring offering such as Grafana.
Dashboard Capabilities
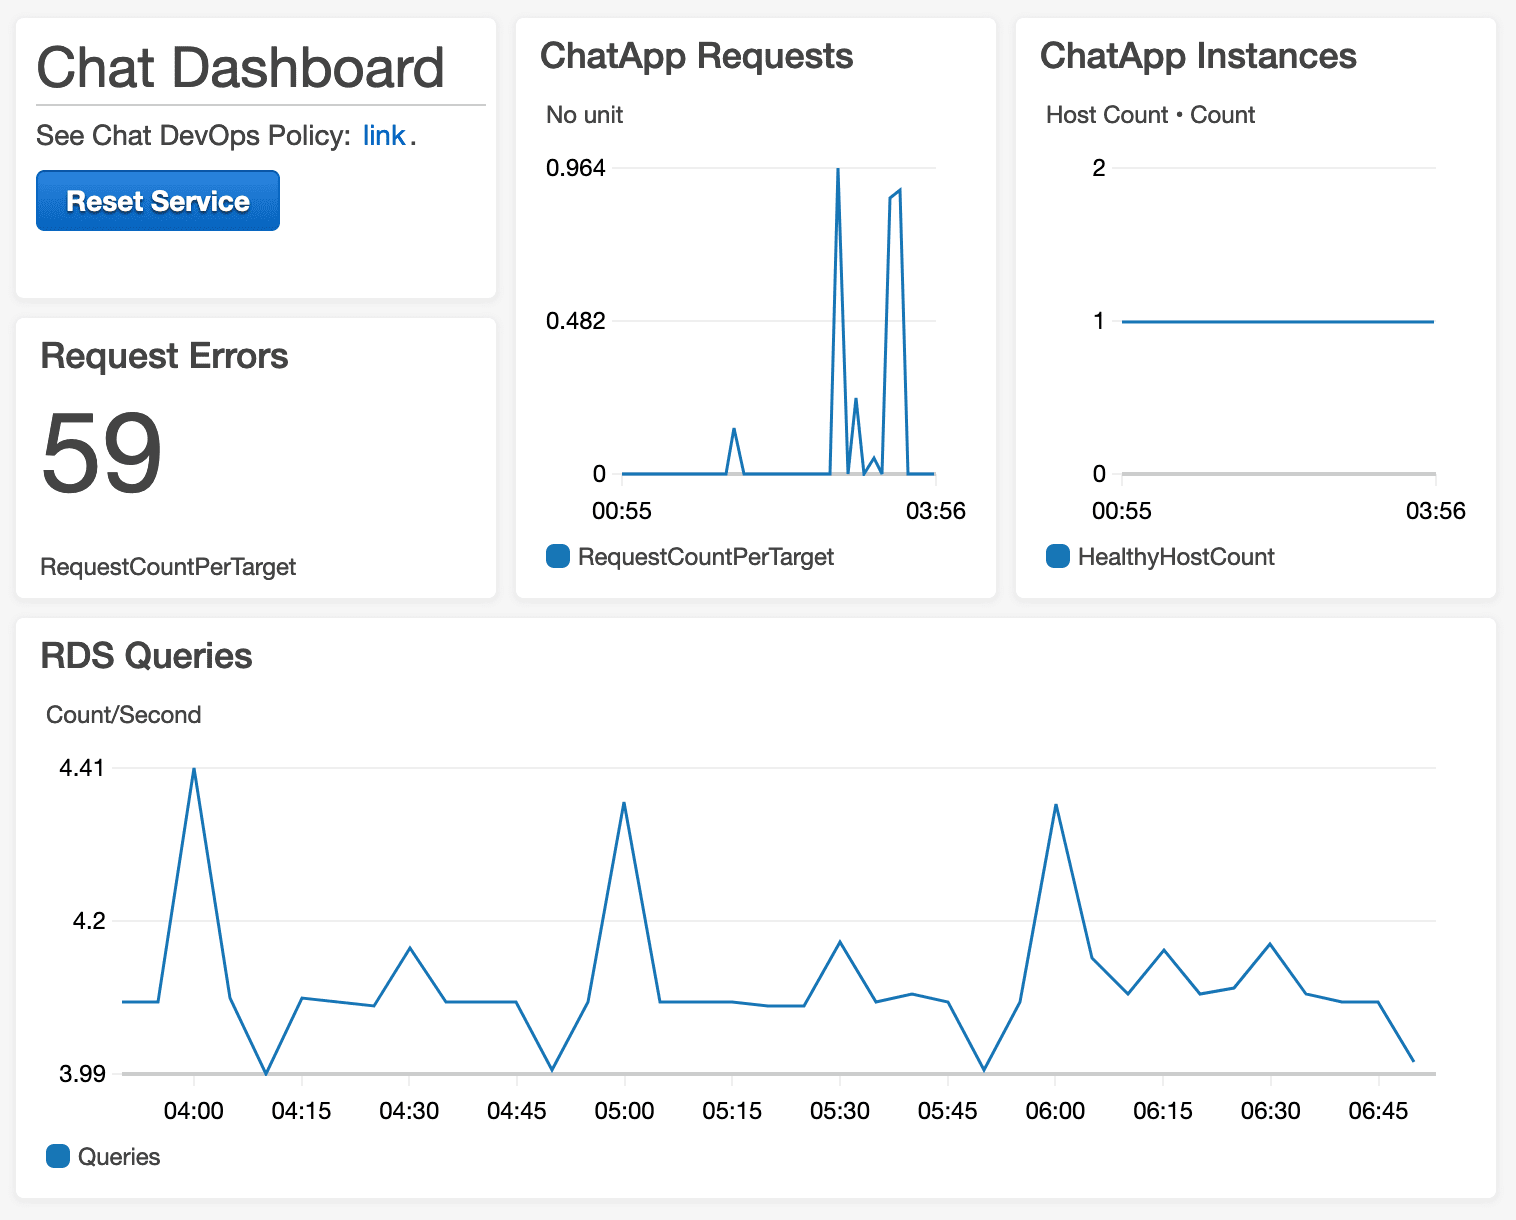
CloudWatch Dashboards display graphical widgets that present the values of resource metrics for your accounts. Dashboards can contain timeline, stacked area, numeric, query or text widgets.
Dashboards are fully customizable and are composed of a grid 24 cells wide upon which you can place graphical widgets to display the value of any captured numeric. Widgets can be rearranged and resized to suit your custom needs.
You can create multiple dashboards and link dashboards together to create a cross-region dashboard. You designate one dashboard as the default that is displayed when CloudWatch Dashboards is viewed in the console.
Your first three dashboards are free, thereafter, dashboards cost $3 per month per dashboard. Not very cheap, so don’t go crazy creating dashboards! However, dashboards can be unlimited in length, so you may wish to create longer multipage dashboards rather than creating many separate smaller dashboards.
CloudWatch dashboards offer a basic set of widgets and does not offer: on/off gauges, dial gauges, bar gauges, heatmaps, or lists. If you require these widgets or more control over your dashboards, consider the open source monitoring tool Graphana.
Creating Dashboards
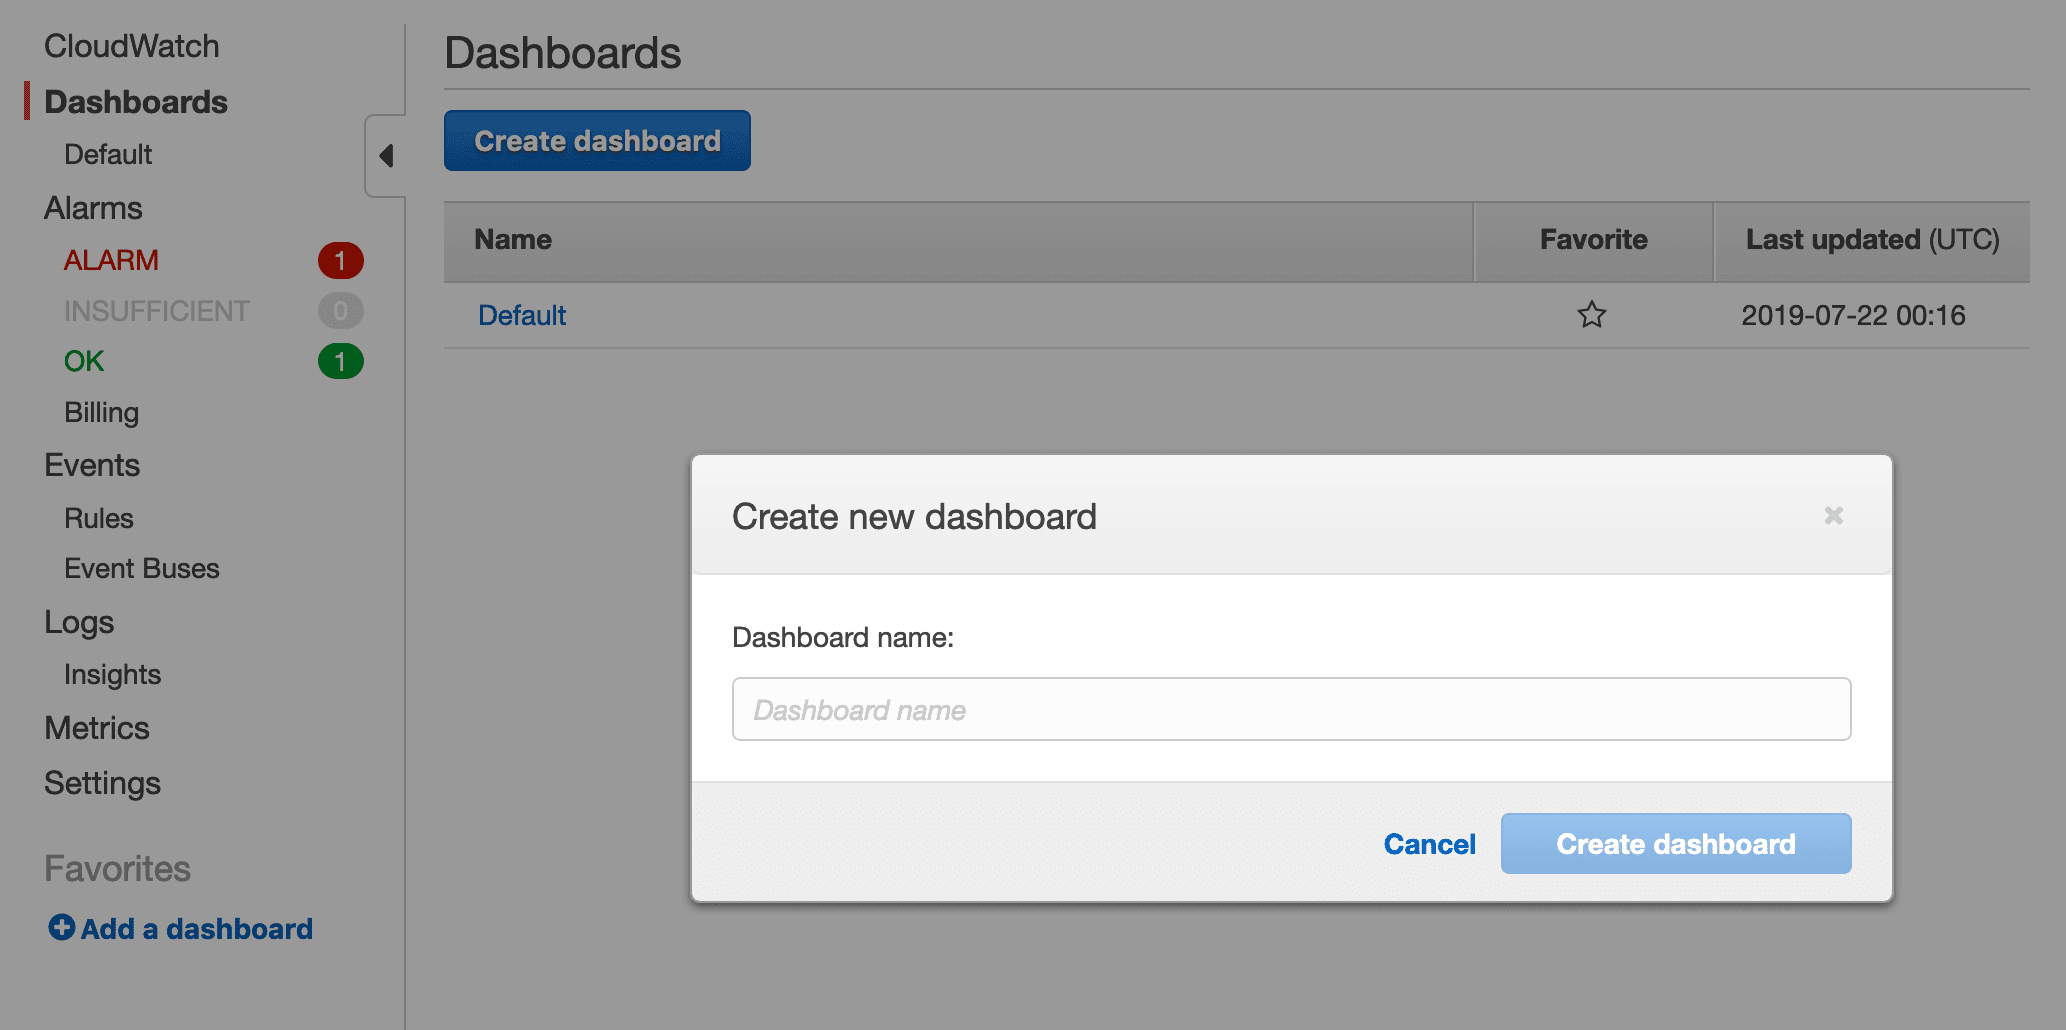
You can create dashboards most easily from the AWS console by clicking the “Create Dashboard” button. But you can also create dashboards via the AWS CLI or API. Support is also provided via CloudFront, the AWS Cloud Development Kit or the Terraform Tool.
Widgets
CloudWatch supports a basic set of widgets: line, stacked area, numeric, text and query widgets.
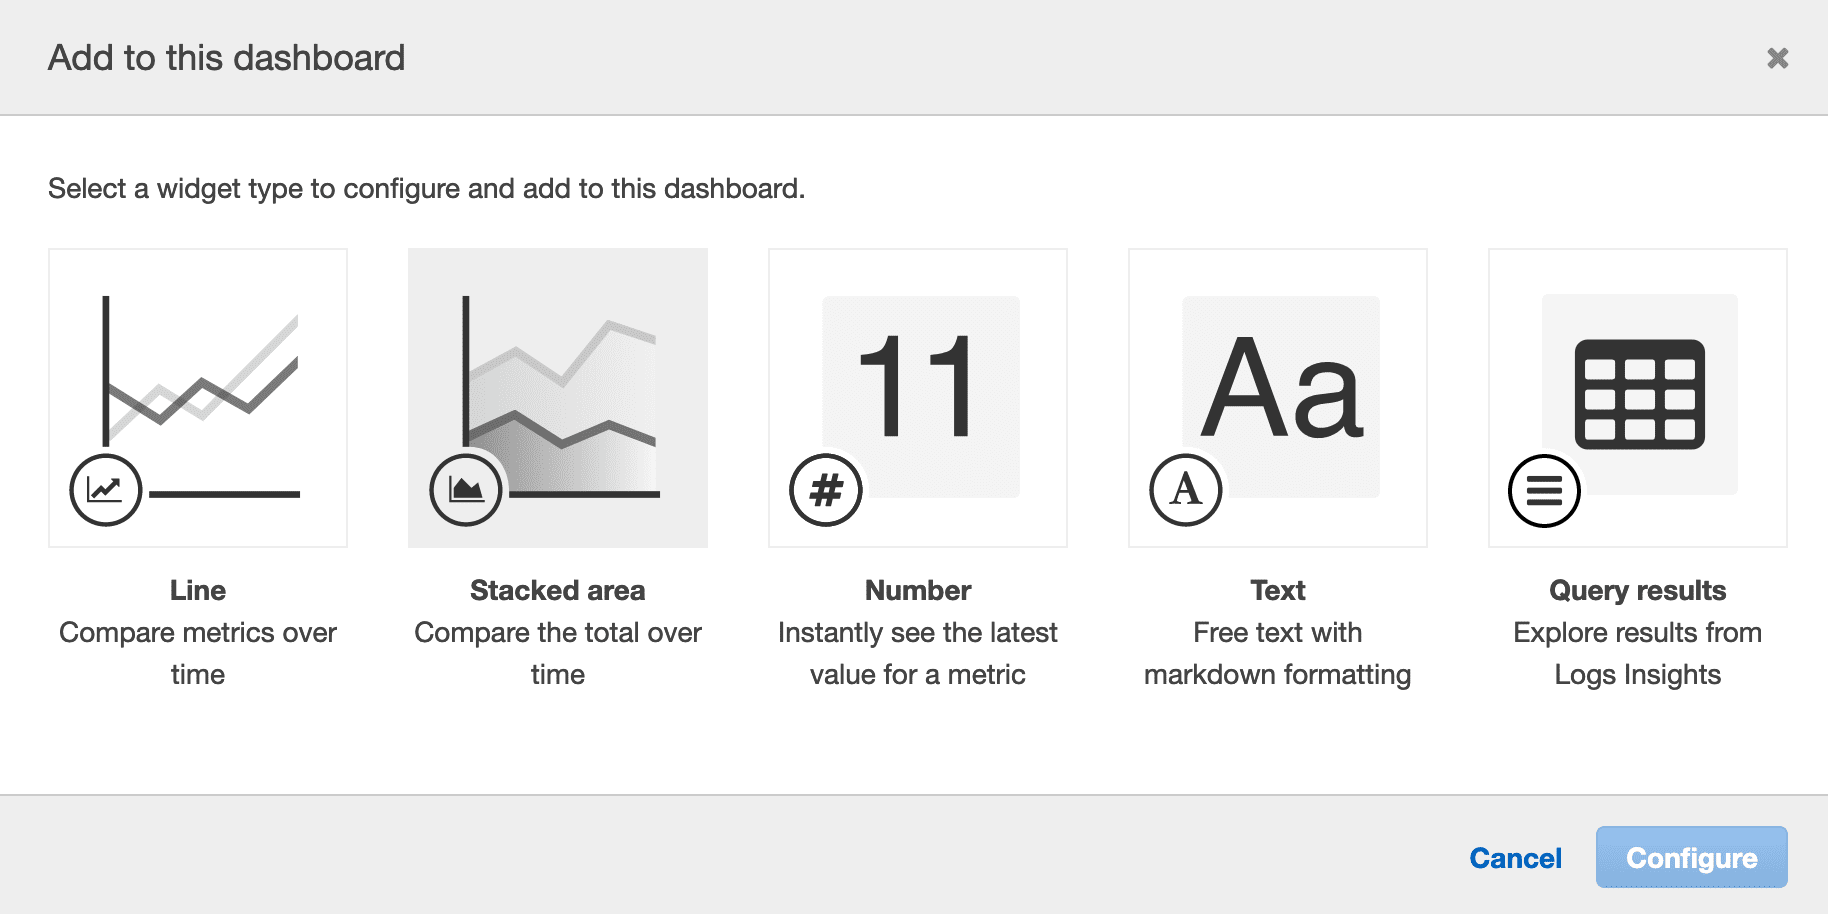
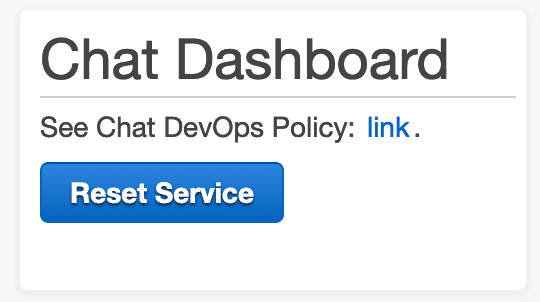
Text widgets can contain Markdown text to display text, buttons, images and links. This can be useful to include reference information, playbooks and immediate actions. For example, a button could be linked to an API gateway Lambda action to invoke remedial action such as initiating a failover.
Metrics
Widgets derive their data to graph from CloudWatch Metrics. A metric represents a time series value such as CPU usage, network transfer or EC2 AutoScale capacity, or even AWS billing. A metric consists of a numeric value and a timestamp.
Many AWS services emit detailed metric events into CloudWatch. The default metrics are emitted and aggregated with a granularity of 1 minute. For additional cost, you can get higher resolution metrics for some services such as EC2 instance CPU usage.
When configuring a widget to display metric values, you specify the desired metric and a statistical view of the metric. The support statistic views are: average, count, max, min, percentiles (0, 50 and 100%) and sum. You also specify the period over which the function is applied. Choosing the right statistic and period is essential to tease out the information you need from the metric.
Lastly, note that metrics can aggregate data from multiple accounts. This is useful when you are isolatign services or environments in different AWS regions.
Metric Persistence and Averaging
CloudWatch automatically averages and archives metric data. For up to 15 days, CloudWatch preserves metric data with a one minute resolution. For 15 to 48 days, CloudWatch uses a 5 minute resolution. For 48 to 392 days, CloudWatch uses a resolution of 1 hour. For 392 to 455 days, a 1 hour resolution is used. After 455 days, the metric data is not retained.
Metric Math
AWS provides a core set of metrics and you can supply your own custom metrics. Sometimes you may need to calculate a derived metric that does not exist in the base set. For this, you can use Metric Math to create computed metrics for use by widgets and dashboards. For example, CloudWatch does not provide an API Gateway 2XX status code metric, but this can be computed by a metric expression using the total request count less the 4XX and 5XX status code counts.
You can use search expressions via the SEARCH() function in your metric math for metrics that update automatically as new resources are created.
Custom Metrics
You can augment the standard AWS metric set with your own metrics for your resources, applications or services. You can publish metrics to CloudWatch using the AWS CLI or AWS API. Once captured by CloudWatch, your metrics behave identically to the AWS core metrics.
Alarms
CloudWatch Dashboards can also present data from CloudWatch Alarms. Alarms monitor the value of metrics and compare against a threshold value. When triggered, an alarm can invoke actions such as sending an SNS email message to your account or immediately scale an EC2 AutoScale group. Dashboards display the alarm status and triggered actions over time. When an alarm is triggered, it turns red on the dashboard for easy identification.
Best practices
Dashboards should display top-level critical information at a glance. The most common mistake is to show too much information in a dashboard. Dashboards should be simple and easy to understand without being cluttered or too detailed. If you have more detailed status information, put that on a separate dashboard linked to the top level dashboard.
Typical information on a primary dashboard may include:
- Is the service operational?
- The recent request error rate.
- The recent request response time.
- The overall service request rate.
When creating your dashboards, keep in mind:
- Focus on the top-level service information.
- Use the most obvious, simple widget to represent the data.
- Put the most important metrics on the primary dashboard.
- Put secondary metrics below the fold or on a separate, linked dashboard. Scrolling longer dashboards can be an effective way to layer information.
Here are some useful tips for creating a dashboard:
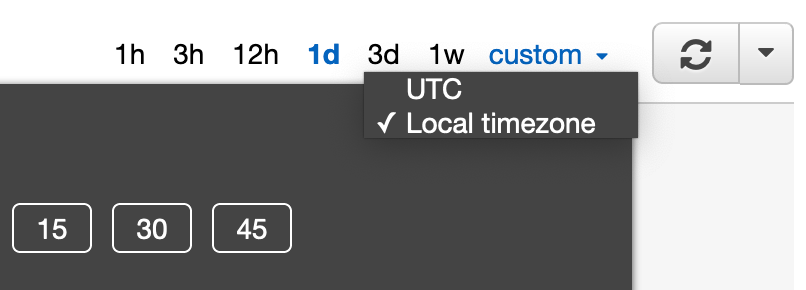
- Consider using your own timezone and not UTC. You can change the default timezone by clicking on the time selection in the top right of the screen.
Use annotation lines on your timescale widgets to mark reference values such as the required SLA threshold. You can define these via the Graph Options tab when editing the metric.
Use the right statistic. Sometimes you want to look at the peak value of a metric. For example: maximum response time may show some concerning outliers that are not visible when displaying the average response time.
Augmenting CloudWatch with SenseDeep
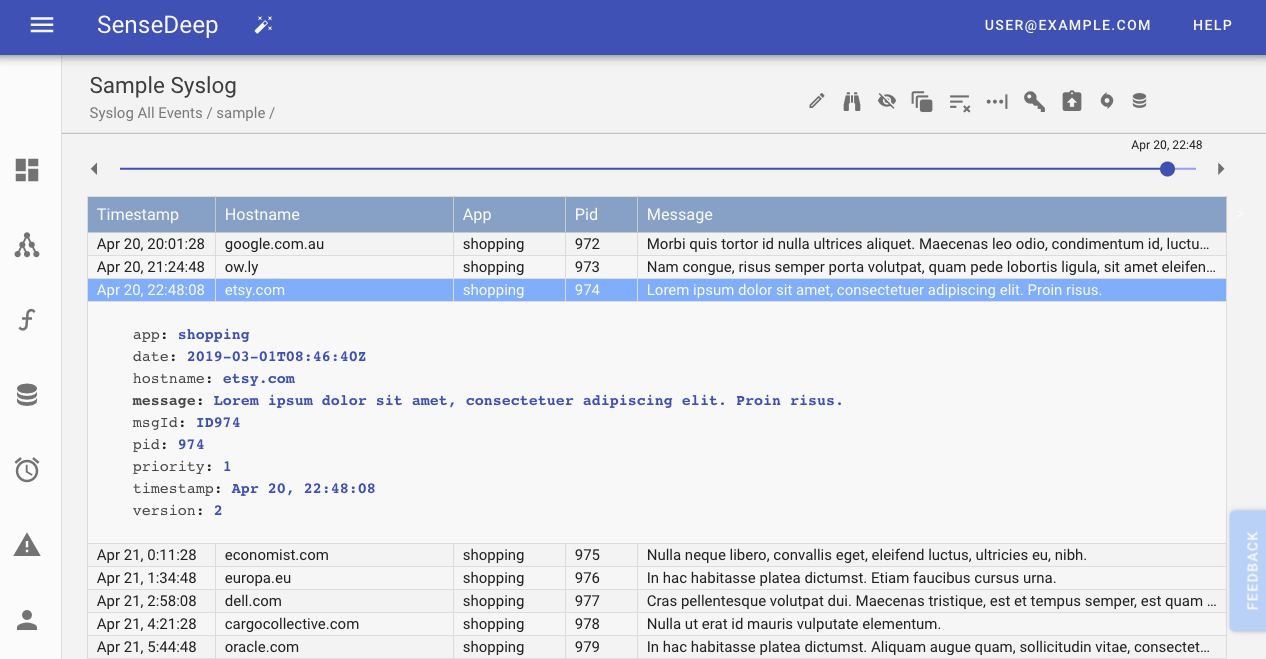
CloudWatch Dashboards provide a view into the status of your AWS accounts and resources. You can augment that with the ability to easily and quickly scan your CloudWatch logs with SenseDeep.
SenseDeep has an awesome logs viewer. It is blazing fast and transparently downloads and stores log events for immediate and querying. It offers infinite smooth scrolling and understand structured log data for easy presentation and powerful queries.
You are welcome to try it for free at: https://app.sensedeep.com/ or learn more about SenseDeep at: https://www.sensedeep.com/doc/.
References
- What is AWS Cloud Watch
- Cloud Logging Checklist
- CloudWatch Doc
- CloudWatch CLI
- CloudWatch JavaScript API
- CloudWatch Custom Metrics
- CloudWatch Metric Math
- CloudWatch Pricing
Try SenseDeep
Start your free 14 day trial of the SenseDeep Developer Studio.

Messages are moderated.
Your message will be posted shortly.
Your message could not be processed at this time.
Error: {{error}}
Please retry later.
{{comment.name || 'Anon'}} said ...
{{comment.message}}