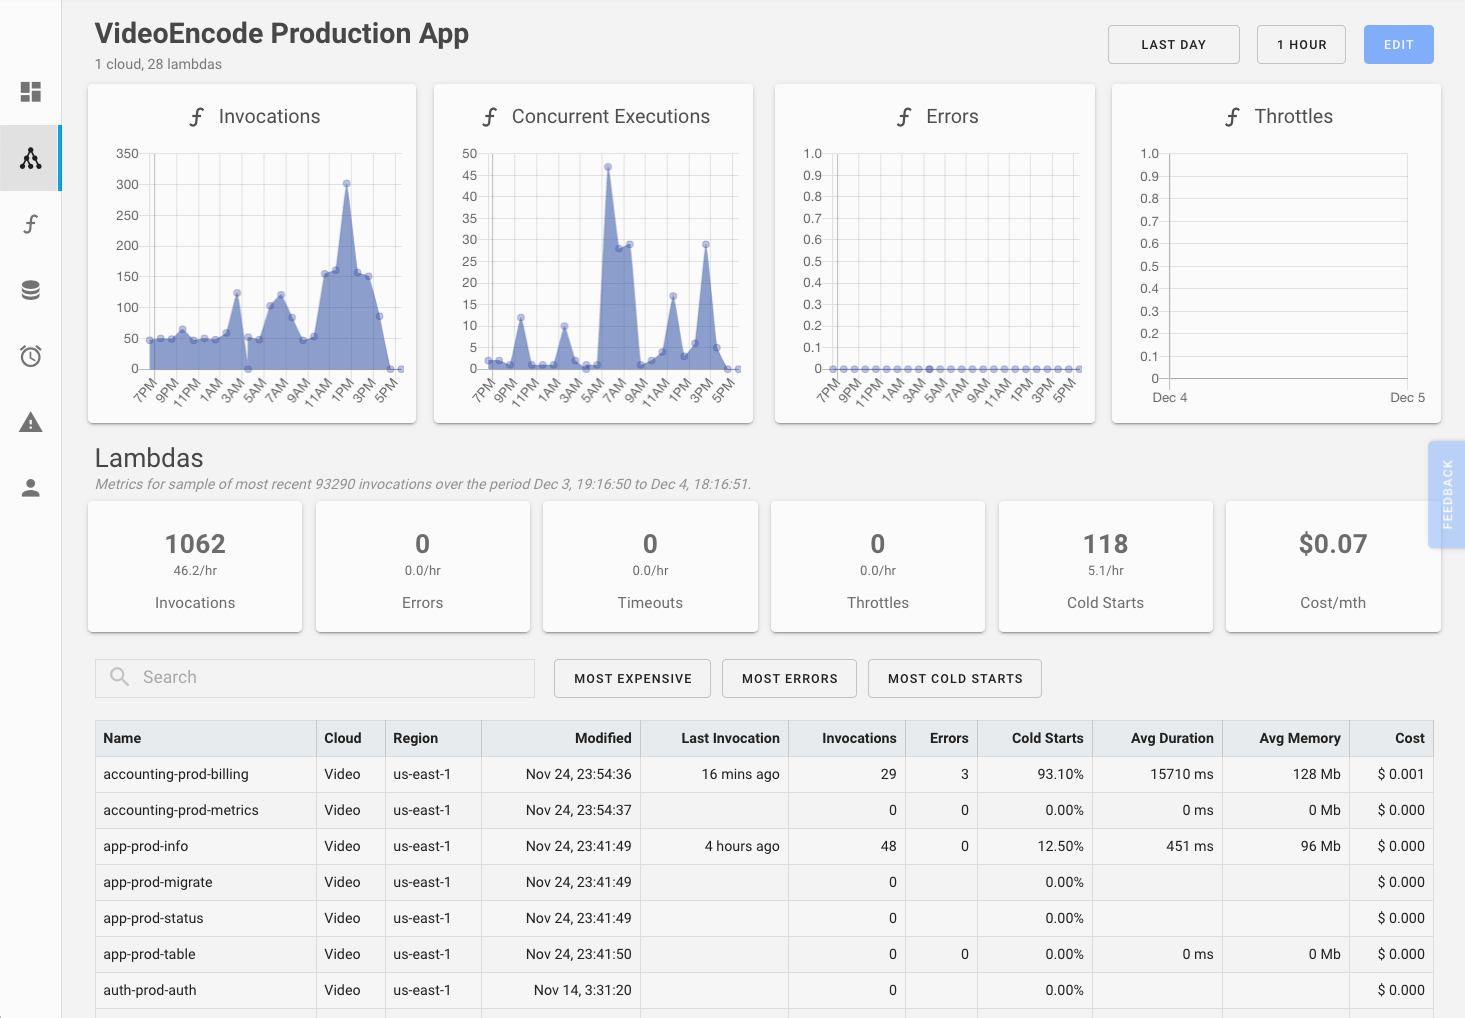
Applications Overview

SenseDeep can optionally organize Lambda functions into serverless applications. These are SenseDeep defined groupings of related lambdas that represent an application and can be monitored as a whole.
SenseDeep Applications may represent discrete applications or services, or they can be deployment configurations such as “production” or “staging”.
Application Lambdas
The Lambdas in a SenseDeep Application may be selected by AWS tags, regular expressions names or an explicit list of Lambdas. If selection is by tags or regular expressions, the set of Lambdas is dynamic and newly qualifying Lambdas will be added or removed as required.
Lambdas may be chosen from one or more SenseDeep clouds. This means an application can span multiple AWS regions or AWS accounts.
Statistics
SenseDeep computes high-level statistics for each monitored application and these are displayed in the applications list. These statistics are computed over the recent set of observed invocations. Depending on the recent activity, their values will vary. For more precise metrics, click on an application in the applications list and review the detailed metrics over any time period you wish to consider.
SenseDeep tracks important metrics for the application’s Lambdas. It aggregates the per-Lambda metrics and detailed invocation logs from CloudWatch into a complete perspective for your serverless applications.
For true observability, it is important to have both a high level view of your application metrics and the ability to pin-point the exact details in a Lambda that may be causing specific issues. SenseDeep provides high level metrics and graphs, while also delivering in context, exact Lambda execution logs.

Metrics
SenseDeep captures all AWS CloudWatch Lambda metrics and augments these with additional critical metrics calculated from your Lambdas invocation history. In this manner, SenseDeep gains additional insights such as your rate of cold starts and the estimated cost for your Lambdas.
Application List
The SenseDeep application list displays your defined applications with some high level application metrics.

Application details include the number of lambdas, invocations (events), the number of errors, cold starts, timeouts and the estimated monthly cost of the function. These metrics are for recent Lambda invocations. You can see metrics for other time periods by clicking on an application to display the detailed application view.