Functions Overview
SenseDeep tracks the lambda functions in your connected AWS accounts. It aggregates per-lambda metrics and invocation logs from CloudWatch into a complete perspective for your serverless applications.
For true observability, it is important to have both a high level view of your function metrics and the ability to pin-point the exact details causing specific issues. SenseDeep provides high level metrics and graphs, while also delivering in detailed lambda execution logs.
Augmenting these monitoring capabilities, SenseDeep provides a powerful alarm/alert mechanism so that your serverless applications can be automatically monitored 24x7x365 and proactive notification when issues arise in your application.
Metrics
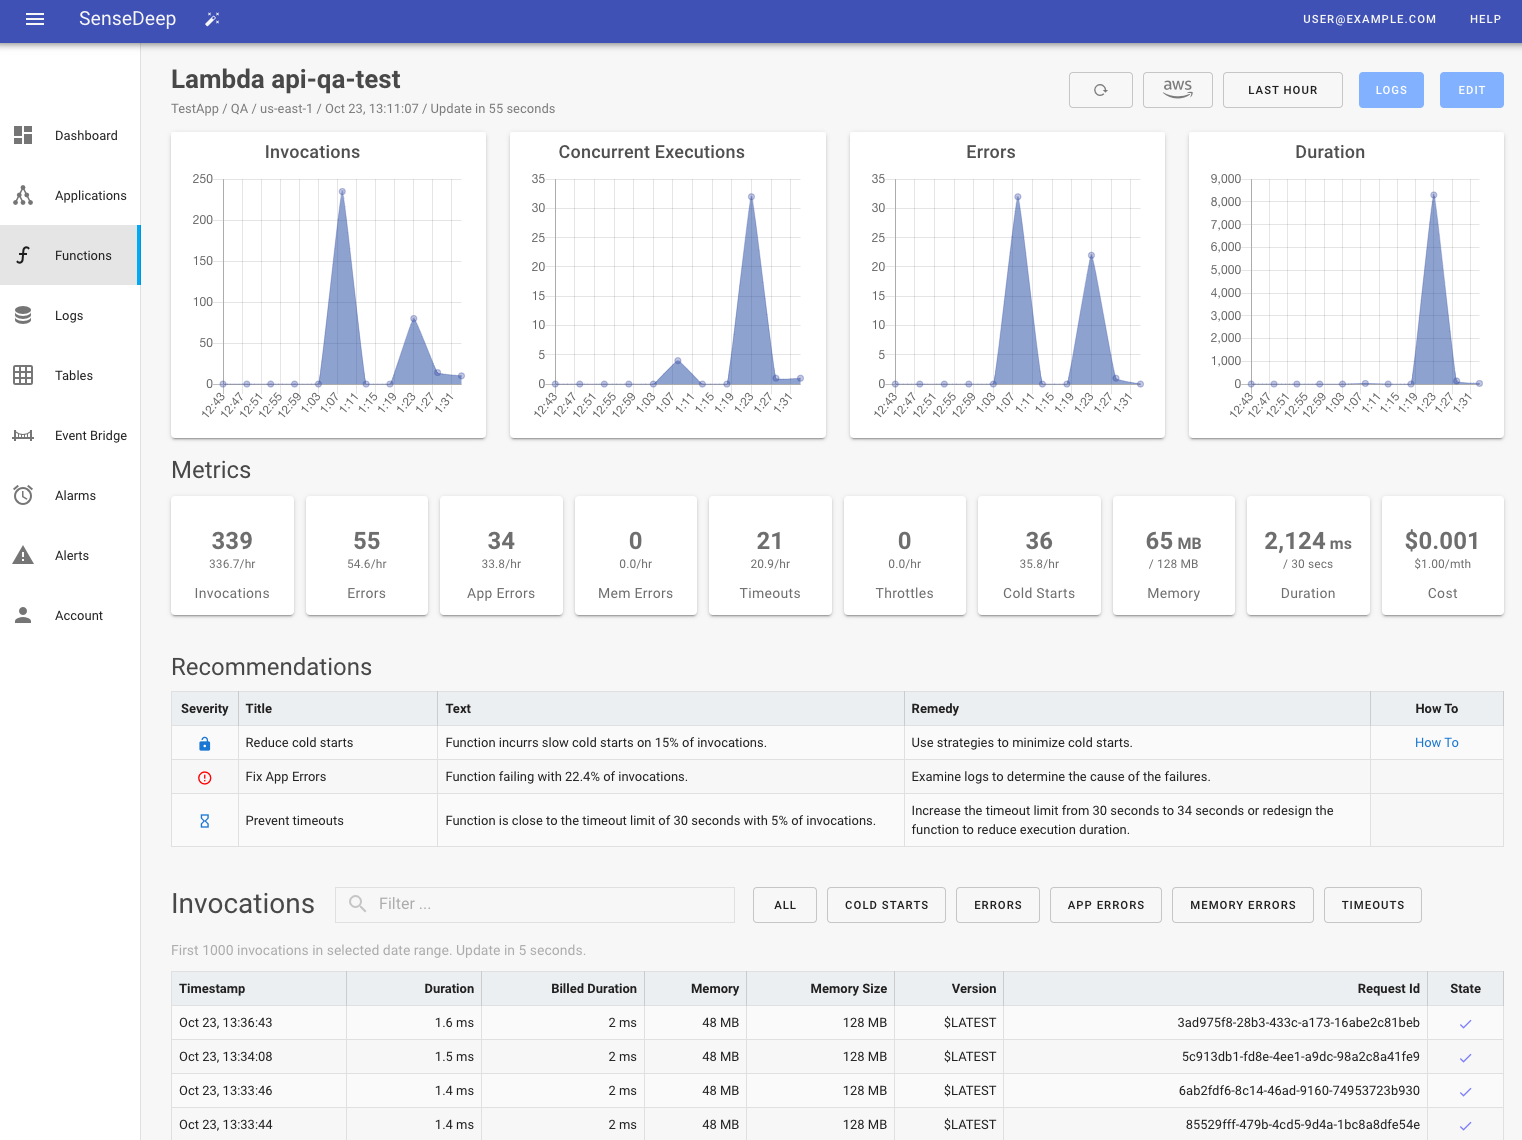
SenseDeep displays graphical metrics for lambda invocations, concurrency, errors and duration. Additional numeric metrics are displayed below the graphs.
SenseDeep captures all AWS CloudWatch lambda metrics and augments these with additional critical metrics calculated by the SenseDeepWatcher from your lambda invocation logs. In this manner, SenseDeep gains additional insights such as your rate of cold starts and the estimated cost for your functions.
You can also add lambda widgets to your dashboards connected to any AWS or SenseDeep lambda metric.
Invocation Logs
AWS CloudWatch is a great initial store for your AWS and application log data. However, it slow and difficult to locate the specific log events in the sea of log groups and streams. SenseDeep captures and correlates your lambda log data and isolates log events into discrete lambda invocation traces. These traces are analyzed for signals of potential issues and overall service trends.
When a SenseDeep alarm triggers, the relevant invocation trace is associated with the alert so you can instantly view the root cause of the alert.
Log Control
SenseDeep can control the amount and type of logging data emitted by your Lambda functions. SenseDeep can define on a per-function basis logging filters to select the volume and type of log messages generated. To assist with debugging, you can define limited duration filter overrides. You can also define a sampling filter that will emit logs for a designated percentage of requests.
Eliminating Delays
SenseDeep is unique in its architecture. SenseDeep captures your lambda invocation history via the SenseDeepWatcher lambda function which runs in your account. It immediately receives lambda logs and stores this securely in the SenseDeep DynamoDB database in your account. Your log data never leaves your account.
SenseDeep directly ingests log data from your lambda functions and makes that log data available in seconds. This greatly reduces lag and wait time as SenseDeep displays log events from AWS as soon as they are available. SenseDeep is the fastest serverless monitoring tool to react and process lambda events.
Function List
SenseDeep maintains a list of your lambda functions and with high level per-lambda metrics.
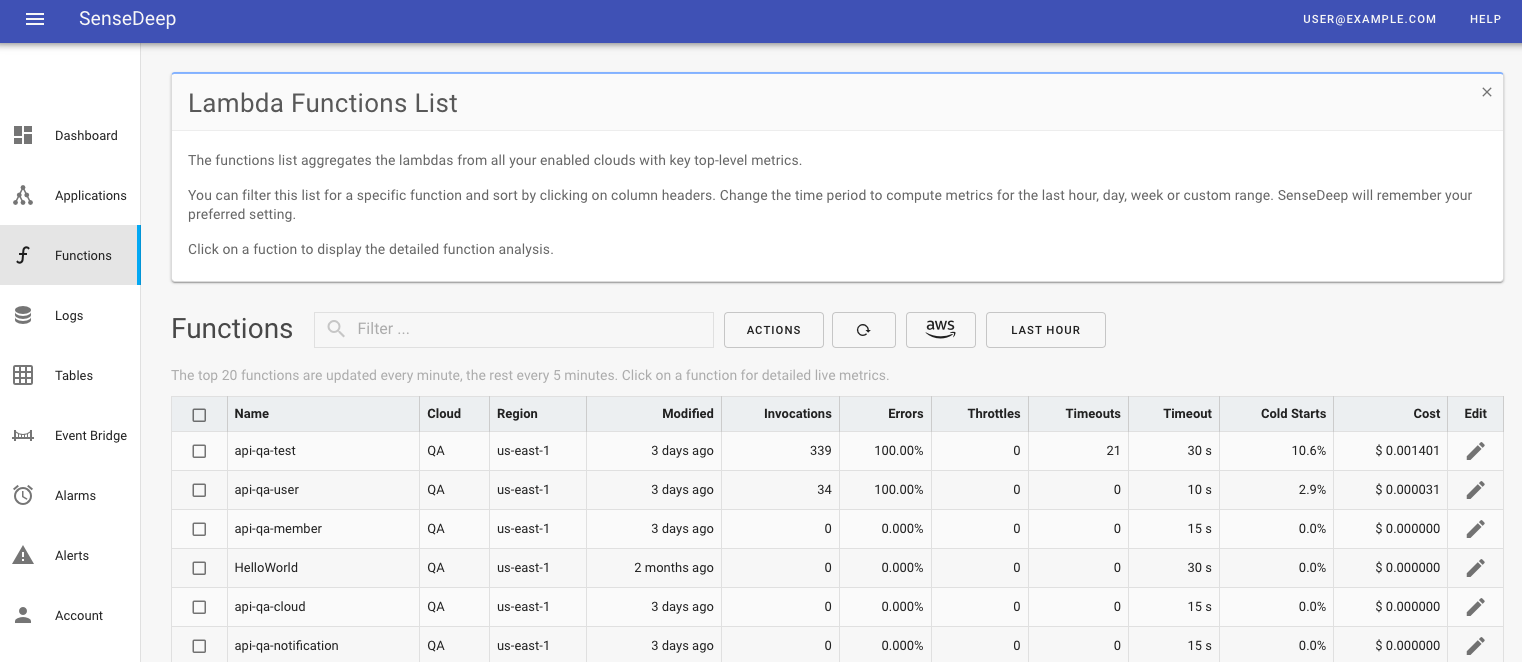
Function details include the number of invocations (events), average function duration, the number of errors, cold starts, memory used and the estimated monthly cost of the function. These metrics are for recent lambda invocations. You can see metrics for other periods by clicking on a function to display the detailed function view.
The function list is sorted by default to elevate the lambdas you most recently and frequently view. You can sort the list differently by clicking on any of the column headings.
Statistics
The function list metrics are computed over the selected date range. Select “last hour”, day, week, month or custom period. For the more lambda metrics, click on a function to view the detailed lambda page.
Recommendations
SenseDeep uses smart recommendations to assist you in tuning and optimizing your lambda functions. SenseDeep uses a suite of deep metrics to detect opportunities to optimize your function’s performance.
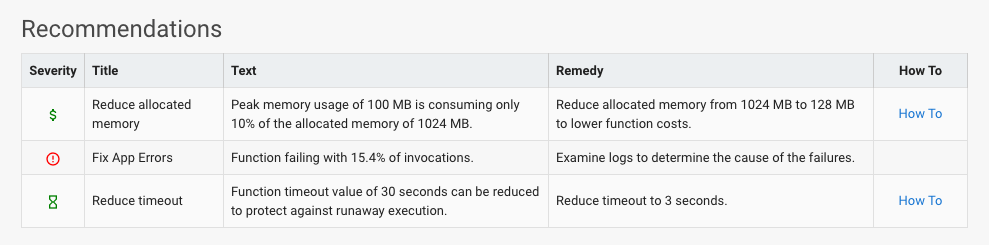
SenseDeep Recommendations will advise if:
- you can reduce allocated memory to save execution costs,
- should increase memory to reduce the risk of memory exhaustion,
- should increase your AWS concurrency limit to handle your peak load,
- should use reserved concurrency to ensure a function can scale effectively,
- have too many function cold starts which are impacting the user experience,
- are experiencing function throttling which is impacting performance,
- should increase the function timeout to prevent timeouts,
- should reduce the function timeout to reduce the risk of a run-away function, or
- should migrate the a heavily used function to EC2, EKS or Fargate to save execution costs.
Logs →