Dashboard Overview
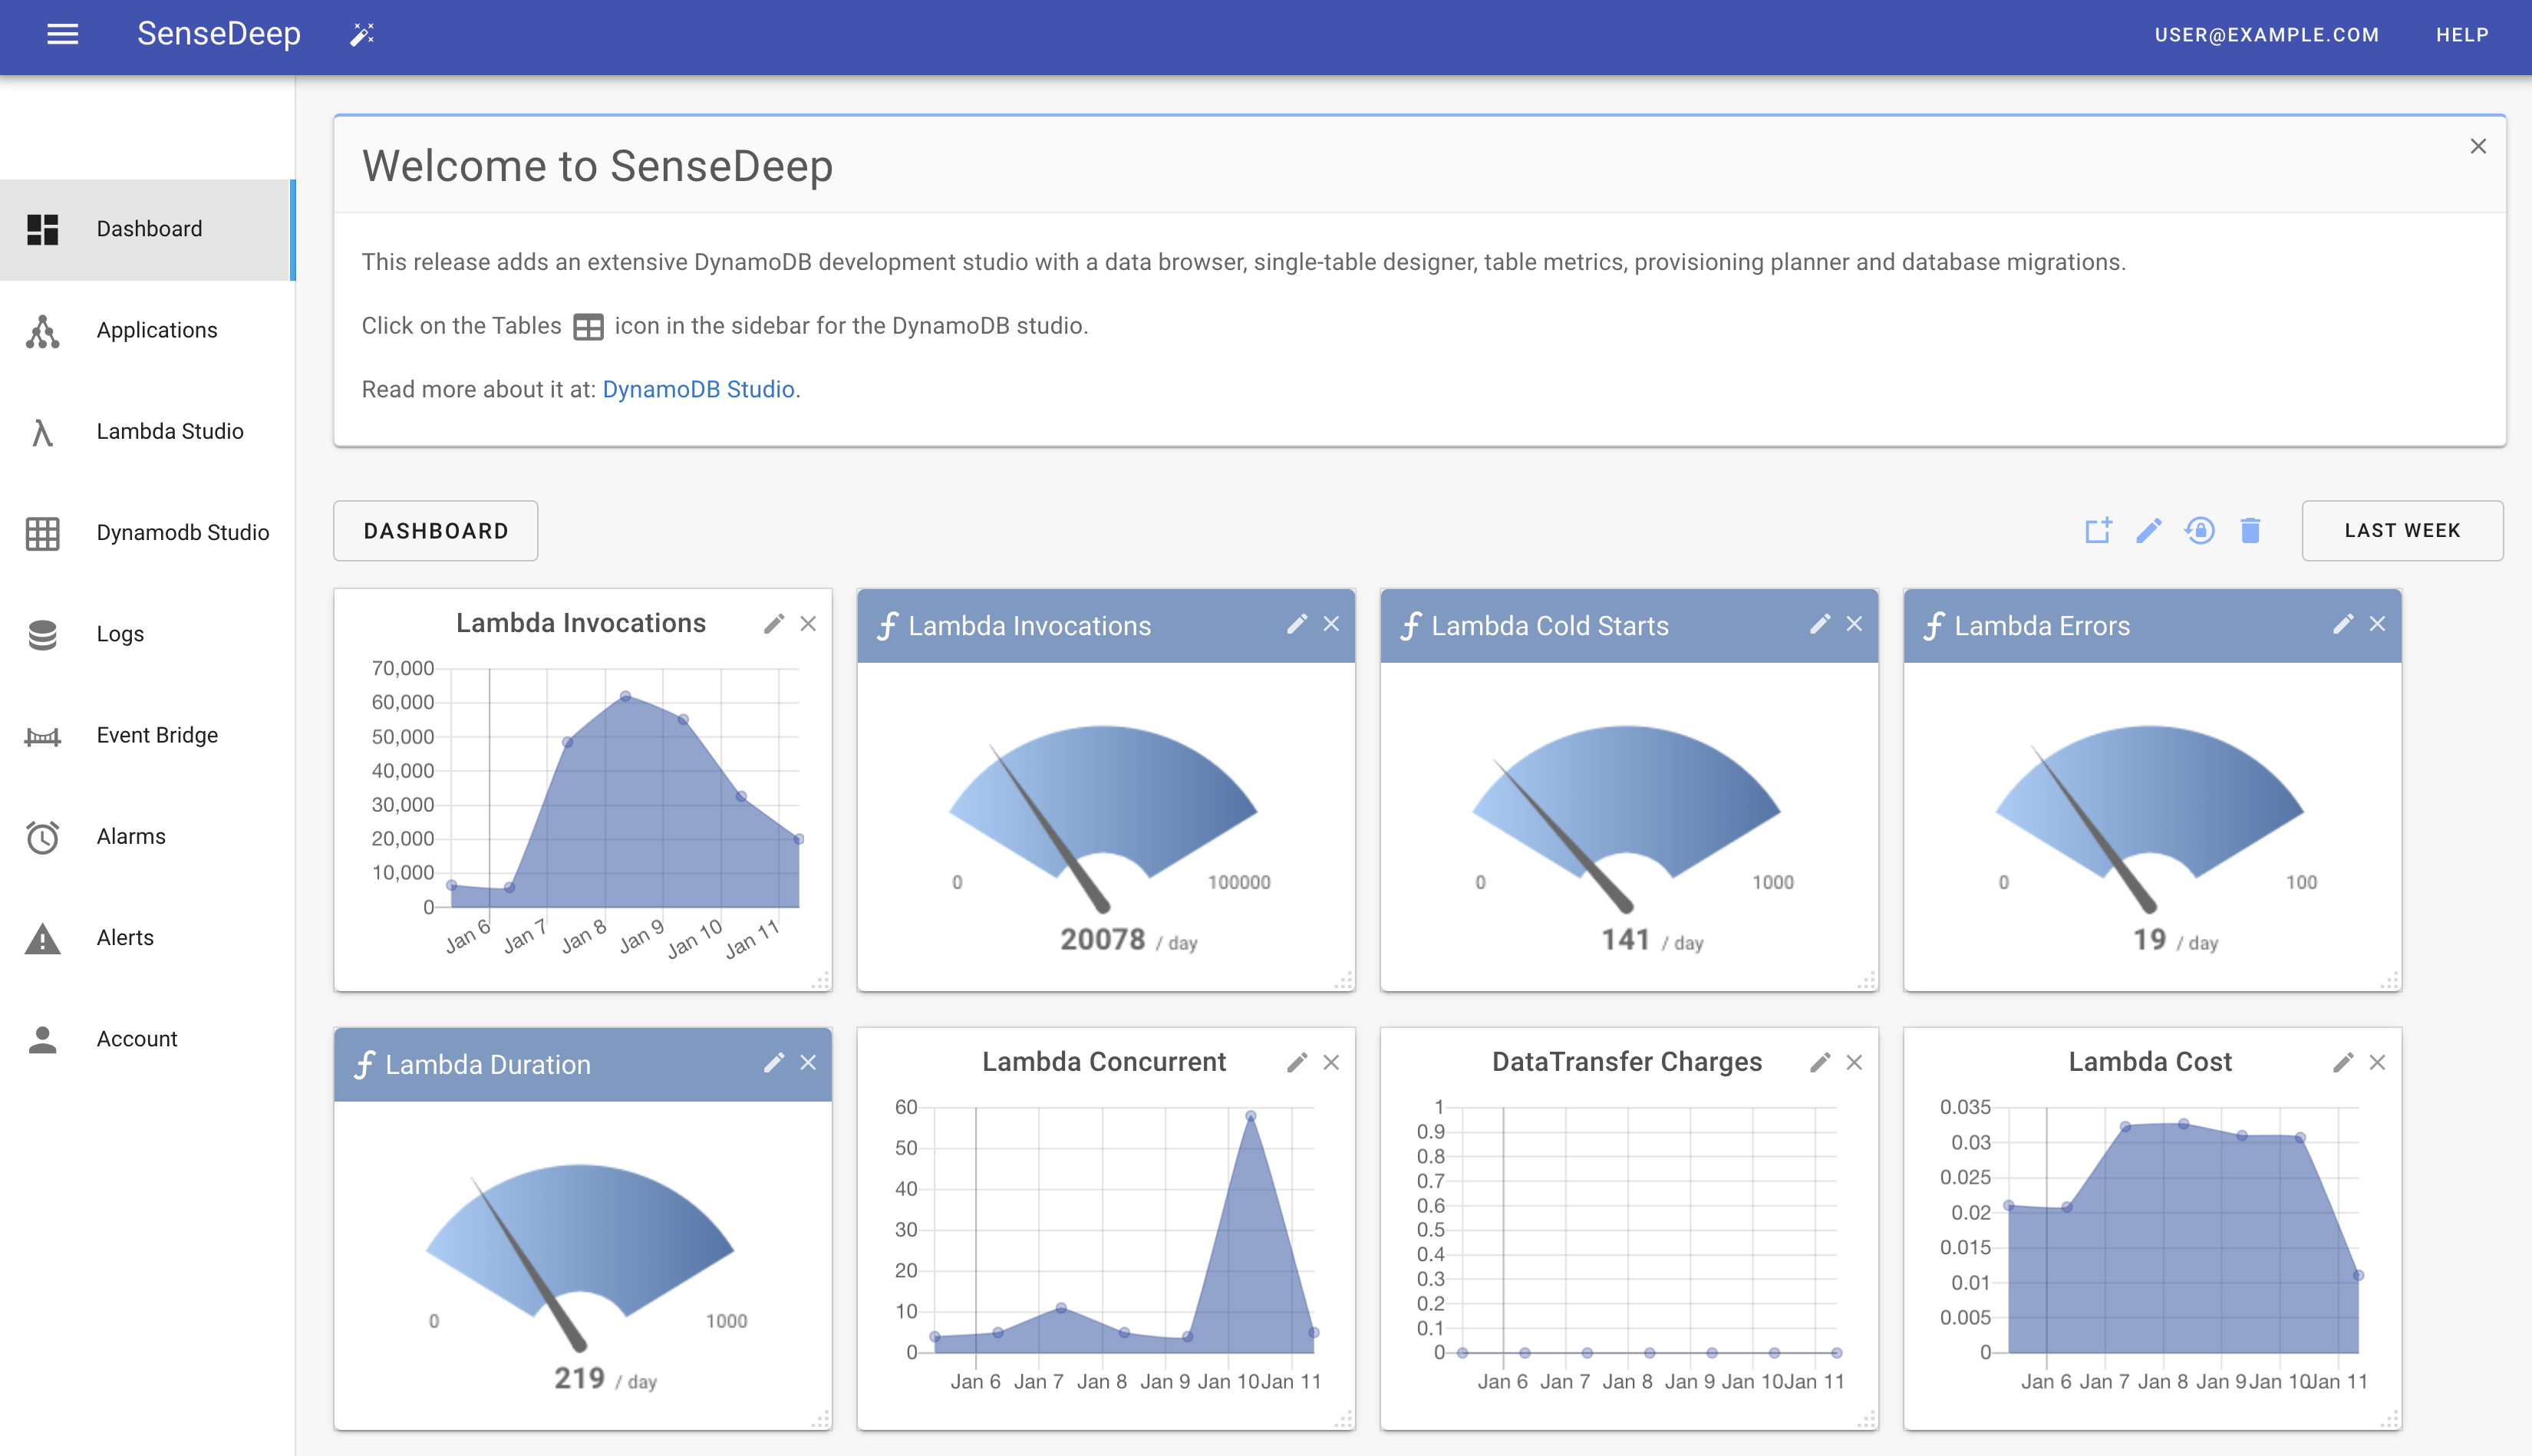
SenseDeep provides configurable dashboards to display informational widgets for your serverless applications. Dashboards are highly customizable – you can add widgets from a wide variety of AWS services including your own custom AWS CloudWatch metrics and you can add, remove, reposition and resize widgets to suit your needs.
Multiple dashboards can be created to focus on a different facet of your serverless development and dashboards can be shared among team members.
SenseDeep Dashboards support:
- Graphical widgets including: graphs, gauges, numeric and text widgets.
- Customizable dashboard layout and widget positioning sizing.
- Responsive design for varying screen sizes.
- Ability to create multiple dashboards focussing on different service aspects.
- Extend from a gallery of additional widgets and data sources.
- Large library of pre-configured widget sets that focus on different AWS services.
- Save and share dashboard layouts with organization team members.
Widgets
SenseDeep supports a suite of widget types including: gauges, graphs, log and lambda views, numeric and text widgets and a top alerts widget.
You can configure widgets to display data from most AWS services including: API Gateway, Billing, Certificate Manager, CloudFront, Cognito, CloudWatch Logs, DynamoDB, EventBridge, Lambda, Lambda Insights, Route53, S3, SES, SNS, States, Usage, X-Ray as well as your custom CloudWatch metrics.
Adding Widgets
To add widgets to the dashboard, click on the “Add Widget” icon which will display the add widget slide-out panel.
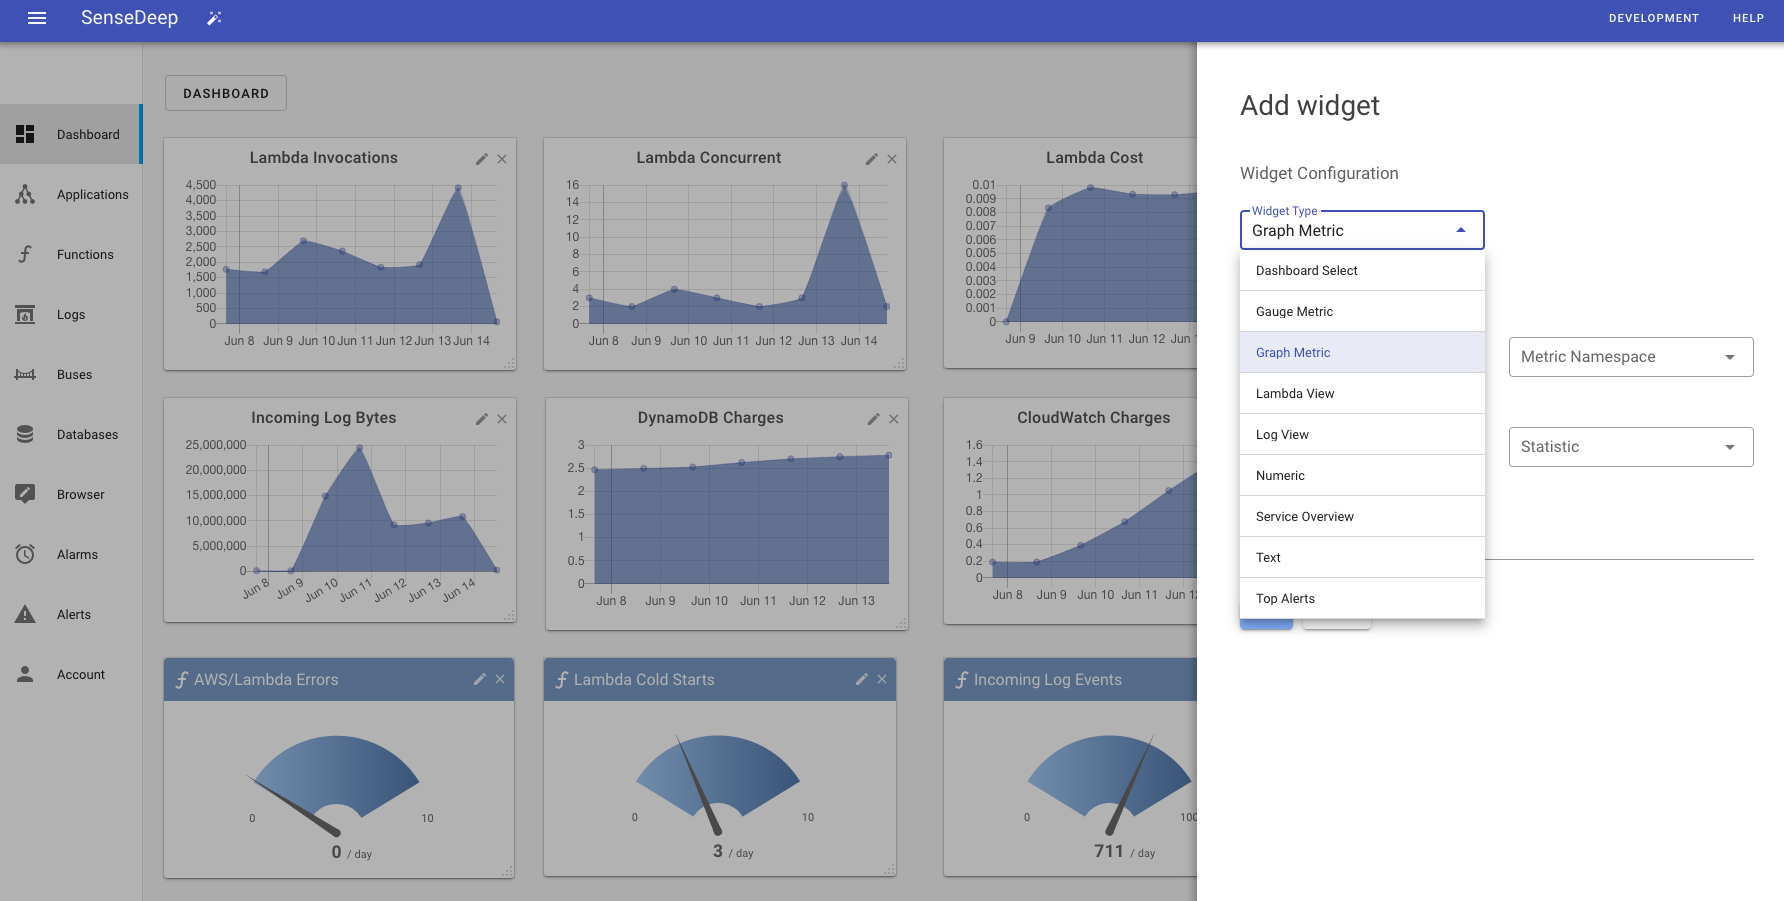
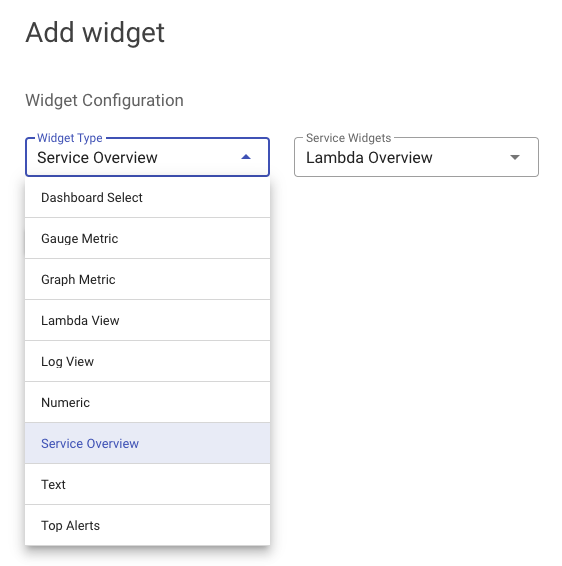
From this panel, you can select your widget type and the wizard will then prompt for the required fields.
If you select a service overview, you can choose from overviews for AWS billing, CloudWatch, DynamoDB, EventBridge, Lambda, SES or SNS.
If you select to create a graphical widget, you can connect to a metric data source from AWS, SenseDeep or any custom metric.
Automatic Layout
When you first display the dashboard, SenseDeep will perform a default layout of the widgets. However, you can perform a layout reset at anytime via the “Reset” icon.
Clicking the reset icon will restore the layout to the previously saved layout.
Manual Layout
You can move widgets by clicking on the title area and dragging the widget to a new position. The SenseDeep dashboard area has an alignment grid of 20 pixels to make it easier to align widgets.
You can resize widgets by clicking and dragging the bottom left widget resize handle to achieve the desired size.
When a widget is moved or resized, it also is moved to the top of the vertical stack of widgets. This will be noticeable if you have overlapping widgets.
You can remove a widget from dashboard by clicking on the (x) icon in the top left of the widget.
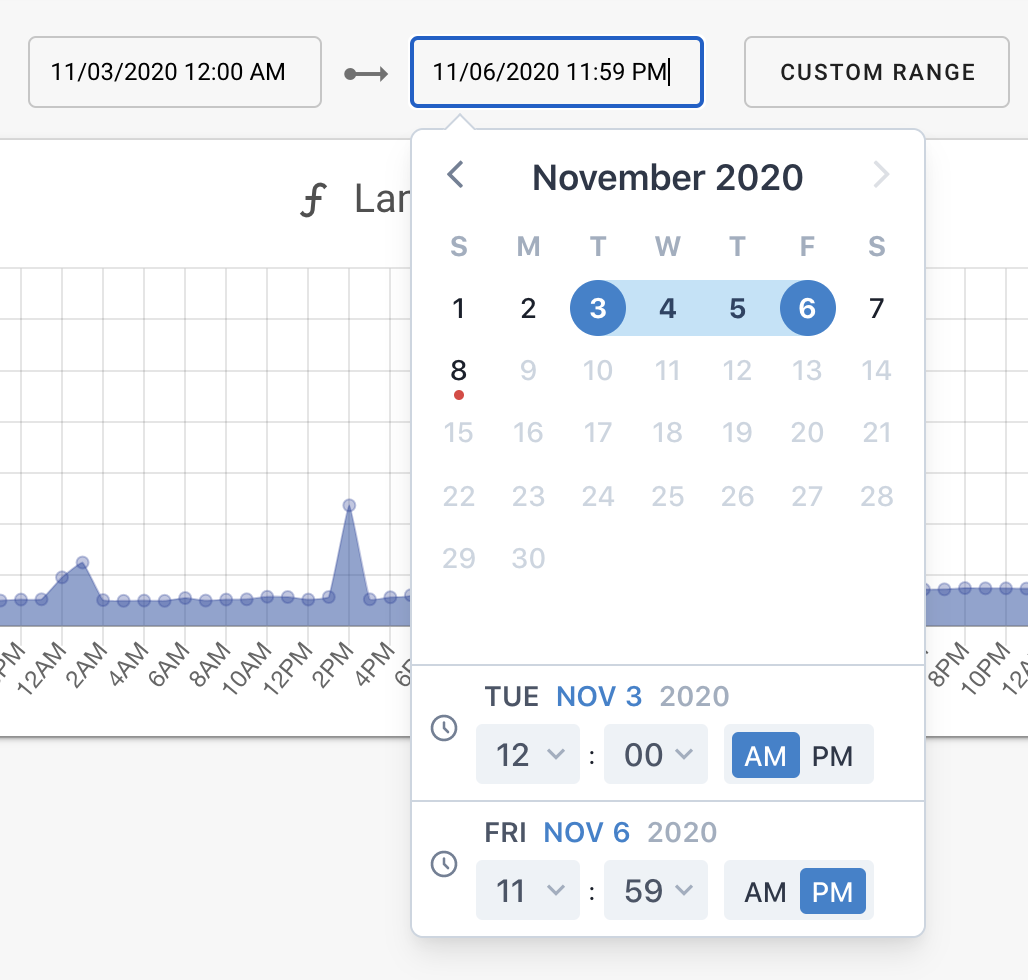
Metric Period and Interval
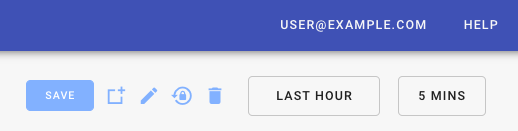
You can customize the data period for the graphs and metrics displayed on the dashboard. At the top center-right of the page, you can select the period to be per hour, day, week, month or custom period using the period button at the top right.
Saving and Sharing
For each SenseDeep organization, the dashboard layout may be saved and shared among the organization members.
When you make a modification to the dashboard such as resizing a widget or moving its position, a “Save” button will appear. Clicking save will persist the layout and set it as the new default layout for you and all other users of the organization.
Creating and Selecting Dashboards
You can create multiple dashboards that focus on different service aspects. For example, you may want a dashboard that features service load graphs and metrics and another dashboard to focus on outages and errors.
You can easily switch between dashboards by clicking on the name of the dashboard in the top left of the home page.
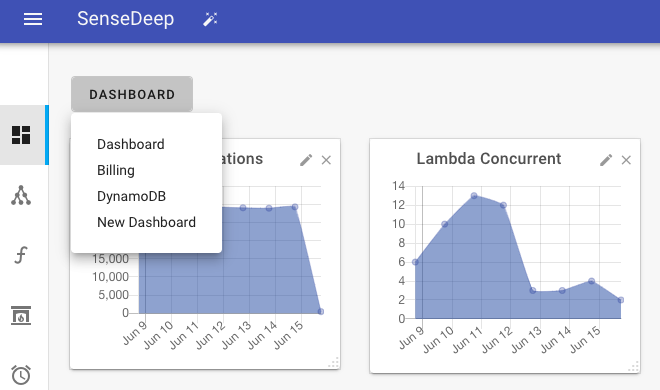
Select “New Dashboard” to display the “Select dashboard” slide out panel. Select “New Dashboard” and then enter your desired dashboard name.
You can also create a dashboard switch widget that lets you rapidly switch to another dashboard.